The post Bright Holidays, Smarter Energy: How Watt Check Helps You Save appeared first on Sense.
]]>Did you know holiday lights can increase the average home’s December electricity bill by 10%? With heating costs already climbing this time of year, every extra dollar counts. The type of lights you use, how long they’re on, and how much your energy costs all make a difference.
For example:
- LED lights use up to 90% less electricity than traditional incandescent bulbs. Running a modest display of LEDs could cost as little as $2 for the season, while incandescent lights might run you $10–$15 or more.
- Switching to LEDs not only saves up to 90% on energy used but could pay for itself in one holiday season, depending on your usage.
Let Watt Check Do the Math for You
With Sense’s Watt Check tool, figuring out your lighting costs is simple—and it’s personalized to your home.
Here’s how we do it:
- Open the Dashboard tab in the Sense app and find the Watt Check tool.
- Test your lights by turning them on and following the step-by-step prompts.
- Calculate your daily and monthly costs based on the number of hours you keep them on.
For example, my family sets our outdoor lights to turn on at 4 p.m. and off at 10 p.m. Using Watt Check, we learned that reducing this window by two hours saved us more than we expected. We also found that switching from incandescent to LED strands not only cut costs dramatically but allowed us to offset the higher upfront price of LEDs in just one season.
Smarter Decorating, Brighter Holidays
Using Watt Check, we’ve set a family goal to keep our December energy bill increase under 10%. This means fewer surprises, more informed choices, and a holiday display we feel great about—both for our wallet and the environment.
What About Old Light Strands?
Switching to LEDs may leave you with old incandescent strands to deal with. Here are a few eco-friendly options:
- Recycle them: Many local waste management facilities, home improvement stores, or specialty scrap metal recyclers will accept them.
- Donate them: Schools, thrift stores, or community organizations might reuse them.
Whatever you choose, remember that small decisions—like recycling lights or switching to LEDs—make a big difference for the planet.
Celebrate Smarter
With Sense and Watt Check, you can create a holiday display that’s both beautiful and energy-conscious. Make this year the start of a brighter, more efficient tradition for your family—and enjoy the holidays without worrying about your energy bill.
Happy holidays from my family to yours!
The post Bright Holidays, Smarter Energy: How Watt Check Helps You Save appeared first on Sense.
]]>The post Monitor Your Home From Anywhere appeared first on Sense.
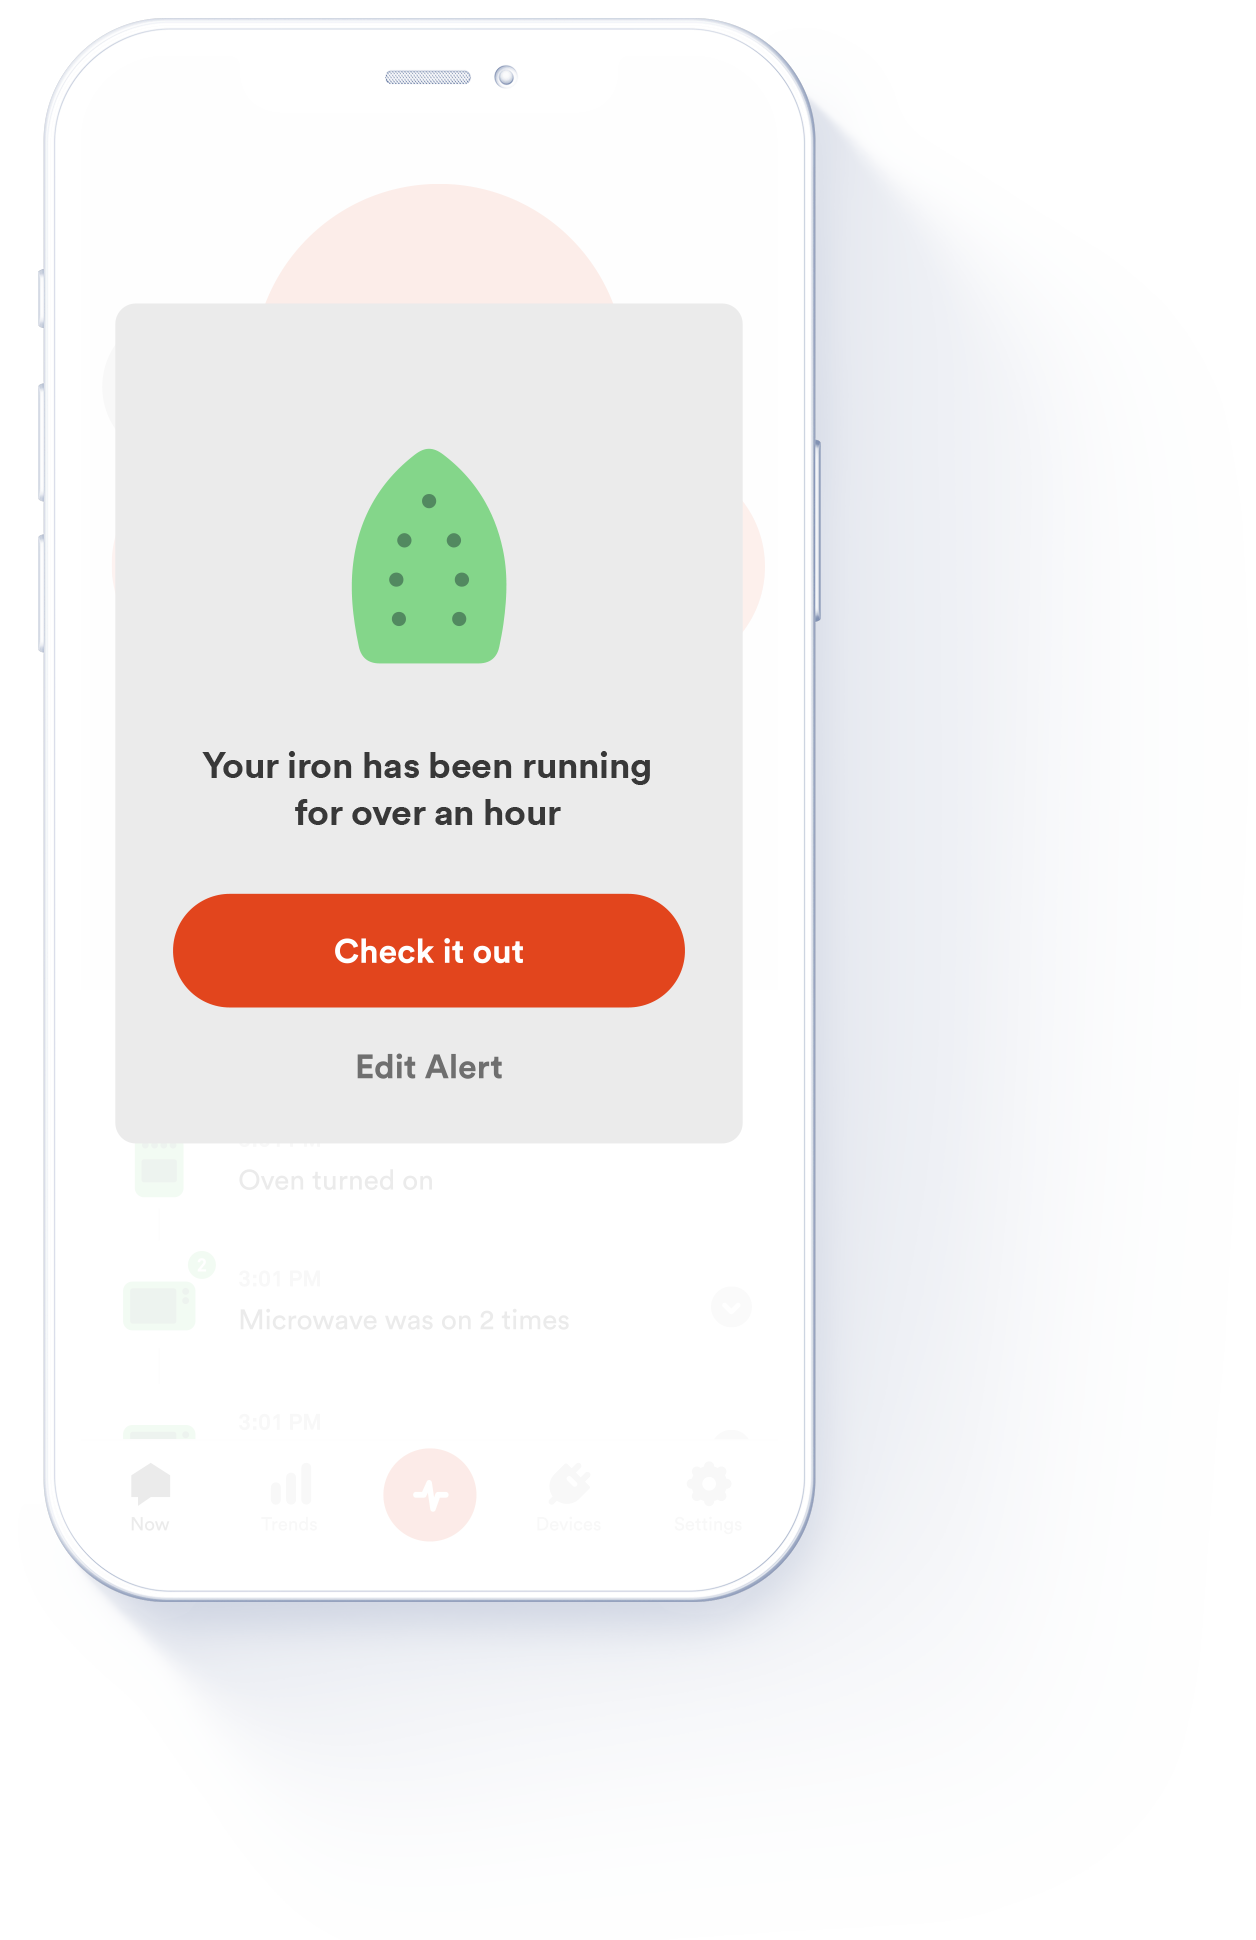
]]>How can you use custom alerts?
- Get notified if your stove is left on for over an hour.
- Know when your heat kicks on—perfect for catching open windows.
- Track your garage door activity for added security.
- Monitor TV time for the kids, with alerts when it’s been on too long.
- Keep tabs on critical appliances, like refrigerators or aquarium pumps.

Setting up a custom alert is quick and easy
- Go to the Devices tab and select a detected device.
- Navigate to the device’s settings (gear icon in the top right).
- Under “Manage,” tap “Add custom alert,” set your criteria, and save.
That’s it—peace of mind at your fingertips. Watch this quick video to see it in action!
The post Monitor Your Home From Anywhere appeared first on Sense.
]]>The post From the App — Compare Your Energy Use appeared first on Sense.
]]>The Compare reports offer peer-to-peer insights. You can use this report to understand your home’s usage in the relation to other homes. Such knowledge can both motivate and reassure you as you get to know your usage and, where possible, look for choices that can help save more energy – and money.
What is the Compare feature?
Use the Compare reports to discover whether your home’s usage is within a range that compares favorably to neighboring homes.
How does it work?
As you use energy throughout the month, you’ll likely notice peaks or dips in your usage. These changes in usage can be contextual (changes in the weather) or specific (you hosted your in-laws for a long weekend or you went away for a week). Compare reports help you identify how those peaks or dips are compare to other homes. They can also help you zero in on inefficiencies in your home’s usage.
With our most recent release, comparisons are more clear and helpful because of three new features:
- Comparison Summaries provide a clear statement that helps you understand how you are doing and how many Watts your home’s devices have used so far in that month. If it’s useful, you may want to dig into the Usage summary above the Compare report to refine comparisons to days, weeks, months, years, or invoice periods.
- Dimension Chips define the parameters we are using to define “similar” homes (zip code, square footage). To generate this comparison, you’re able to add basic information about your home in the Home Details (Settings > My Home). That information helps us tailor your comparison. We will continue to add in points of comparison automatically, so no action is needed from you.
- Location Control allows you to toggle between different locations to broaden or refine your comparison. By default, comparisons are generated based on “all Sense homes” (all homes in the U.S. that use Sense), and you can now choose which comparison you want to see:
- My Area shows all Sense homes in your zip code
- My State shows Sense homes in your state
- Anywhere will let you compare to all Sense homes
When to use Compare
Use Compare as much as you want! It will take about a month for Sense to collect enough information about your home to generate a full comparison. Until your Sense account has collected more than two days of consumption data, you will not see the Compare reports at all. Instead, the Sense Home app will remind you to wait for more data. After two days, comparisons are unlocked and will improve gradually through the first month as more days of data are collected. Once your usage hits 30 days of consumption data, the comparison will be based on a rolling 30 days.
Over time, you will certainly want to return to Compare reports as your home’s usage with the seasons or after notable spikes in use (or lack of use). You will also want to use Compare reports after you make significant changes to your home’s device usages, like adding an EV charger or a new pool pump, or replacing the furnace with a heat pump.
Just as your home evolves, the Compare reports will also evolve, and as more homes become Sense-enabled, and your comparisons will become increasingly informative.
Resources
Learn: AC energy use comparison
How do I download my data?
Learn about Sense Compare
The post From the App — Compare Your Energy Use appeared first on Sense.
]]>The post Which Sense Home App Features Are You Using appeared first on Sense.
]]>In this post, we’ll look at the app’s five main screens.
- Now – a real-time tally of every watt your home is using
- Dashboard – see your spending month-to-date and what you’re trending towards
- Meter – see the real time map of your home’s usage overall, and watch it change as devices go on and off
- Devices – individual usage statistics and information for individually discovered devices.
- Settings – account info, appearance, Wi-Fi configuration, integrations, and much more
What’s on right Now

The Now screen is likely the one you’ll be checking most often – it’s the quick-to-read snapshot of your home’s activity. It will change over time, as more devices are detected.
You’ll see usage plotted as a bubble graph, with bubble size relative to power consumption. Bubbles appear for each device that’s been detected. You’ll also see your Always On load, which accounts for phantom loads that seem to always be on, like DVRs, printers, Wi-Fi speakers, and desktop computers that consume a small amount of power in “standby” mode, and a bubble for Other, which represents the usage for devices whose signature hasn’t yet been identified. When you first begin to use the app, you might only have one or two bubbles shown, but that number will grow over the coming days and weeks as Sense analyzes your home energy usage and identifies more device signatures. In the bottom right corner you’ll see a real time measurement of how much wattage your house is using.
At the top of the timeline listing, if you’ve allowed it, you may see notifications about a significant change in your home’s usage. These changes are often easily explained by shifts in weather or household activity, but you can learn a lot as you come to understand the impact of such changes.
Scroll through the timeline on the bottom half of the Now screen lists identified devices as they turn on or off. Tap a device to get its detailed usage information and statistics, and to give names to devices Sense has identified but needs your insight to properly name. The detail view lets you see how much an individual device or appliance contributes to your usage numbers overall. You may choose to set up a notification for an individual device, as it turns on or off or if it operates for more than a set amount of time. All this can help you track – and reduce – inefficient use.
Analyze your energy use

The Dashboard screen makes it easy to see how your home is consuming energy over time. The info provided is both aggregated and divided by devices, and can be configured to show information for a range of time periods.
Usage
The Usage card, at top, shows how your usage is trending for the month and helps you anticipate the charges that will be added to your monthly bill. Tap on the card to dig into this usage information. You can track how much energy your home is using by the day, week, month. year, or billing cycle (if you’ve defined your billing dates in the Settings screen). By default, you’re seeing total energy use for your whole home, but you can also click on individual devices to see Dashboard for that device with estimated costs. The usage presents both kWh and dollars for a particular day.
This detail can be very helpful if you’re trying to shift usage to take advantage of off-peak utility rates during other parts of the day. Or, if you have solar, to better sync up your consumption with your energy production, like charging your EV in the middle of the day when solar generation is at its highest. You’ll notice that the statistics for each device also change as you modify the viewing range.
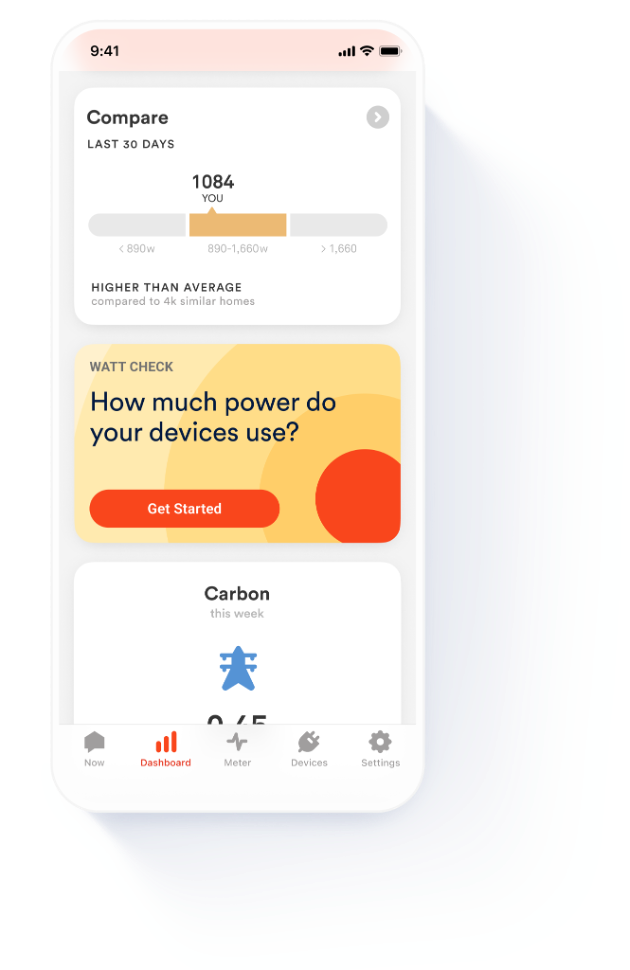
Compare
Return to the top of the Dashboard (there’s an arrow in the top left), and you have a Compare card, which helps you see how your home’s usage compares to similar homes. Again, tap the Compare care for more detailed information and measurements, and for an expanded range of comparisons. For more information on these comparisons, see this article.
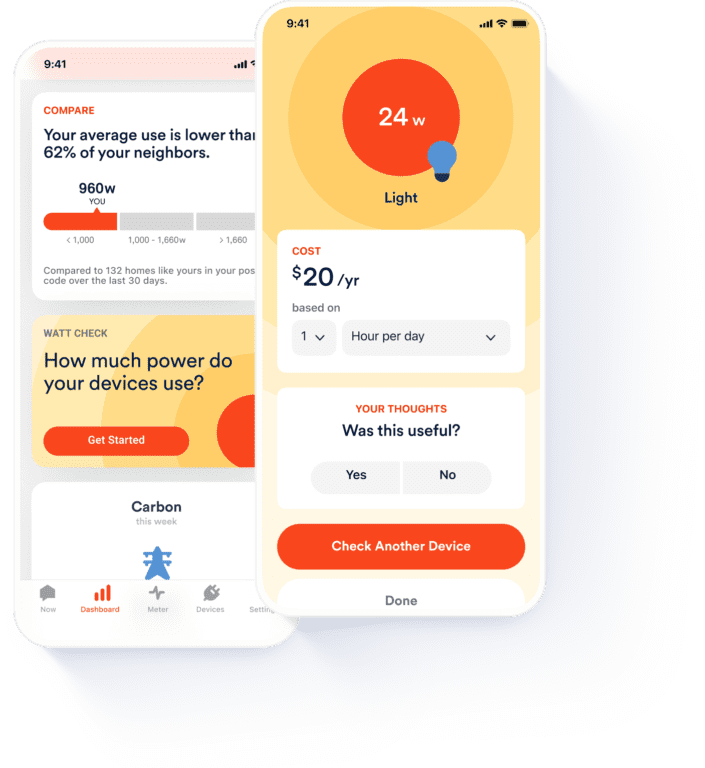
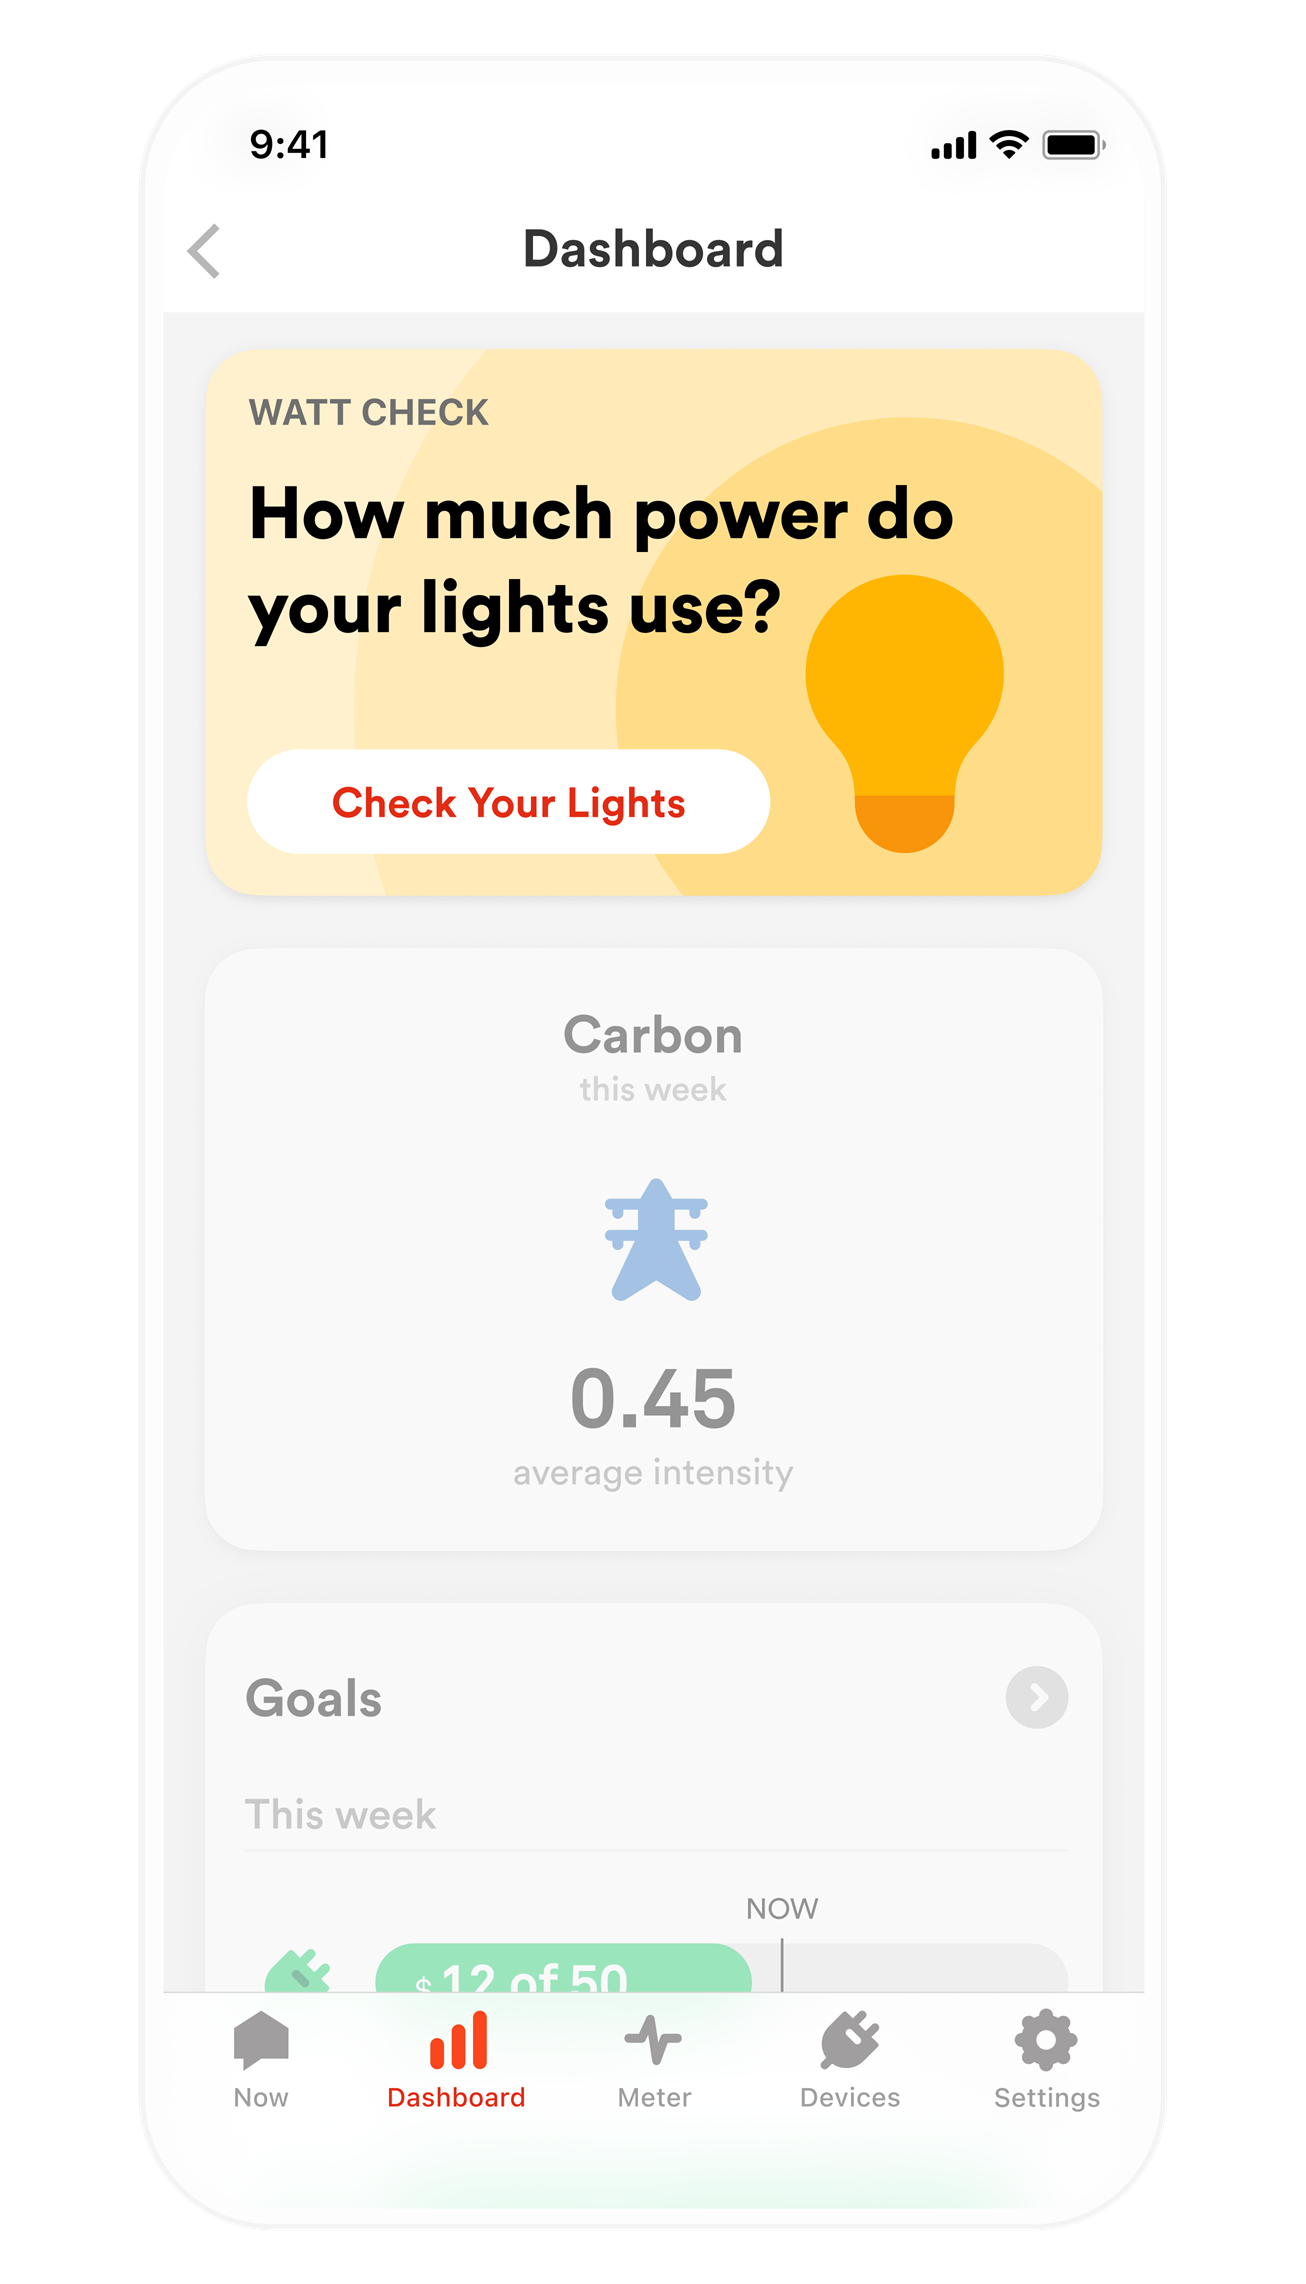
Watt Check
The Dashboard card also includes Watt Check, which is a handy tool for measuring how much energy (and resulting cost) is necessary to run certain appliances or devices in your home. Watt Check is not related to device detection, but it can be a very useful tool for you in identifying inefficient appliances or lights, or understanding where you might want to plan for upgrades that help save down the road.
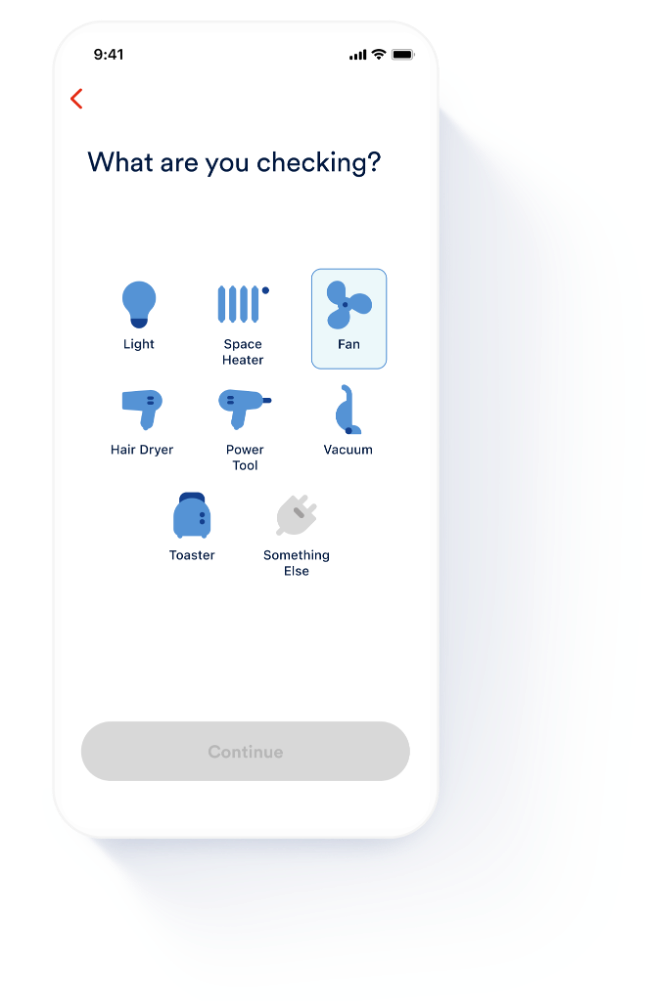
Watt Check is intuitive to use, so just press “get started” to measure usage in lights, space heaters, fans, dryers, power tools, vacuums, and toasters. The interface will walk you through the steps to test one or several tools. This article explains it all.
Carbon
Under Dashboard you also find a Carbon report that helps you understand the carbon intensity of your weekly usage, including a listing of how your utility has combined resources, and in what percentages, to provide the energy your household used. These measurements allow you to estimate the environmental impact of the kWh your utility provider has generated to make electricity, information you may choose to use as you work to lower your home’s impact on carbon usage. Learn more about how to use the carbon intensity feature here.
Goals
Goals is an important area of the Dashboard, as this is where you can create your own goals. After you’ve perused the dashboard reports, you may have a better idea of what your household may want to do to conserve energy. And with that insight, you can set specific goals. You may decide to target inefficiencies or define thresholds for your home’s use of energy … and then you can let the app help you track your home’s progress on those goals.
To set goals, you can target Always On and overall usage goals, and if you have Sense Solar you can set goals for that as well. In setting goals, you can define various periods of time, including day, week, month and cycle. This article tells you how.
Labs
Labs are just that, experimental sections where Sense is testing and validating certain kinds of data to see if they can be added as standard features in the future.
The big picture, minute by minute!

The Meter graphic offers a detailed real time representation of what’s on right now right down to the sub-second level. This is where you can see some of the particular signatures that each device has when it turns on or off. Sense detects devices by identifying these signatures and other unique qualities in the context of your home. This view is also valuable in showing that your home is often a very busy place electrically, which is why device detection may take weeks as the system isolates one signature from an overlap of many signatures operating at once.
Sense will need some time to learn your home and its most significant devices. Some small devices, or those used only intermittently, may not be identified. But even before Sense discovers the primary devices in your home, it’s easy to see how much energy they consume just by turning them on and off and watching the Power Meter in real time.
Use your fingers for this report. Scroll left to see past activity. Pinch with two fingers to zoom out (or back in).
Note that you can also zero on specific time periods to see the meter minute by minute, or by the hour, day, week, or month. This may also help you define goals that you record under the Dashboard feature.
Where is the action?

The Devices screen gives you a bird’s-eye view of all the devices that have been discovered in your home, listed first by what is currently on, and then alphabetically after that. If devices are currently turned on, the app colors them blue. In the first few weeks after installation, this list may be limited, but the longer your Sense system operates, the more devices Sense will learn and the longer this list will grow (and the smaller your Other bubble will become).
By tapping on any device name, you get to detailed views and see historic usage statistics for that device. The app provides an average measurement of how much power the device consumes when it’s on, and estimates the cost over a year, based on your usage. But move down to the usage card here for views of that device on a weekly, monthly, annual, or bill cycle basis. If you’ve listed a device in your survey that Sense is still working to identify, the app may provide information on how that device (a fridge, for example) tends to operate on average, so that you can estimate cost while you await its explicit identification.
When Sense discovers a device, it awaits your help to accurately name that device. Sense presents you with a list of Community Names, which leverages crowd-sourced data to give you insights into what other Sense users have named similar devices. You’ll want to use these historical data clues and your knowledge of your home’s appliances to help pinpoint what the device actually is, then name it and fill in its details in the app.
If you tap the gear icon in the top right of the screen, you can add the make and model information. By doing this you’re also helping to contribute to the accuracy of the Community Names feature, and helping the Sense data science team build its database of device signatures, in turn improving detection accuracy for the entire user community. This Details tab also includes fields for information unique to your home, like the location, and personal notes like “Filter changed 01/01/23” to help you stay organized and up-to-date with appliance maintenance.
Getting the details right

The last main screen inside the Sense Home app is Settings, where you’ll find a long list of fields that you can customize to define how Sense works for you.
Under the Account tab is where you can select what kinds of notifications you want to receive, including push and email notifications relating to particular device activity. You can also define your security preferences.
At My Home, you’ll define the details of your home to help with the “similar homes” comparison. You can also define electricity info such as billing cycles and rates, including Time of Use rate zones, if those apply in your area. Here is where you also add information on integrations (connected devices like smart plugs or Alexa) and otherwise define your network connection info. And if you need your serial number, you’ll find it in the System report along with a lot of information on the signals your Sense system receives. This is also where you will go if you ever need to reset your data.
You can also use the setting menu to change the appearance of your Sense screen, to contact the Sense Support team, or to ensure you are using the latest version of the app.
Web App
For the cherry on top, don’t forget that your Sense can also be accessed from your desktop web browser via the Sense Web App. While the Web App can do almost everything the mobile app can do, it also offers some unique features, like the ability to export your Sense data for further processing (spreadsheet or external app).
Whether mobile or Web, the Sense Home app is your dashboard for what’s going on (and off) in your home. Take some time, explore its features, and get a better understanding of your power usage. Have a suggestion to improve the Sense monitor or app? Be sure to reach out to our support team here. And check out Sense Saves to see how others are saving with Sense.
The post Which Sense Home App Features Are You Using appeared first on Sense.
]]>The post Watt Check: Smart choices. Big impact. appeared first on Sense.
]]>Get insight. Simply. Now.
Sense recently announced the Watt Check tool, which extends the lights-only version of the original Watt Check, gives you the information you want, when you want it.
Measure how much electricity an individual device uses as soon as you set up the Sense Home app. Or measure any time you just want to evaluate how much a device’s use contributes to your electricity bill. And as usage changes.
Ready to get started?
Step 1
In the Dashboard tab, scroll down to the Watt Check card and let it walk you through the steps to understand how much a device contributes to your bill.
Step 2
Choose from a range of appliances that turn on and off easily, or measure “something else” and tell Sense about that device for future updates.
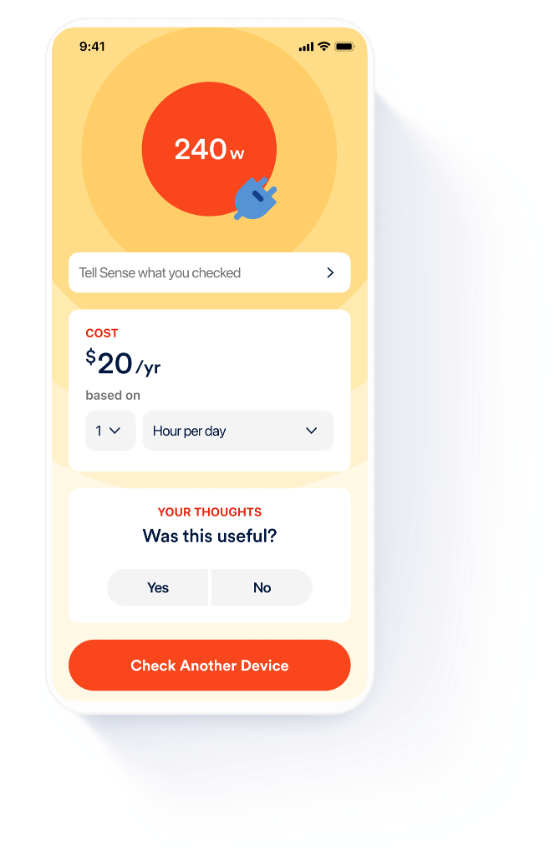
Step 3
Once the measurement is complete, Watt Check lets you manipulate its results to define time amounts and increments that you can more closely mirror your home’s usage patterns – and compute for differences in use over time or as seasons change.
Using Watt Check to get smarter about your energy use
- The Watt Check process only requires about 15 seconds per device, though you may have better results if you run your tests during periods when large devices in the home are turned off (think of the clothes dryer or check for a relatively flat Meter tab).
- It complements Sense’s device detection to let you see what energy a device uses even before machine learning has isolated the device’s signature.
- Watt Check may help you name devices that are detected, as it can help you differentiate between devices with similar electronic signatures.
- You can compare the readings in your Meter tab for the time you run your Watt Check, and see what impact that device has on your home’s overall usage.
- Watt Check can help you get some answers to what’s in your ‘Other’ and ‘Always On’ bubbles at the Now tab.
- If your electricity provider bills you by rate zones, covering times of the year or times of day, you can use Watt Check with the Meter feature to decide when your household should (and not) run certain appliances whose use can be managed.
We hope you enjoy this new feature. If you find it useful, let us know with a review at the Apple App Store or Google Play Store.
The post Watt Check: Smart choices. Big impact. appeared first on Sense.
]]>The post One User’s Method For Getting The Most Out of Sense appeared first on Sense.
]]>Five Steps For Getting the Most out of Your Sense
Here are the 5 steps that worked for me, nicely leveraging the Sense AI learning period to manually gather and collate additional information about all the devices in a user’s home. They can be followed by users who have a basic understanding of power and energy usage in a home, and really want to understand where most of the electricity in their home is flowing.
- Orient yourself to Sense terminology and app features after the install as Sense begins detecting things using Sense AI.
- Inventory all the electrical and electronic devices in your home, while you are waiting for Sense AI to learn and detect devices.
- Assess all the plug-in devices in your home using a roaming smart-plug or two. Use other techniques (detailed later) to assess wired 120V and all 240V devices.
- Deploy (intelligently) smart plugs based on the home’s inventory, detected and non-detected devices, and assessment results.
- Tune detection further using additional Sense-provided capabilities and integrations.
Orient
Install Sense and get familiar with the extensive capabilities built into the app. A few important considerations while orienting yourself:
- Document your install if you can. Take advantage of having the breaker box cover off. Capture photos of the Sense monitor and CTs, as well as the wiring running off your various breakers.
- Start your Inventory as Sense starts inventorying key devices in your home. New users are asked to fill in the “My Home” section followed by a series of 8 questions about major devices. Heat, fuel type, cooling, water heater, fuel type, number fridges/freezers, stove/oven, laundry, humidifier/dehumidifier/pool. Based on those answers Sense automatically creates ‘estimated devices’ in your device list (they appear as light gray). Once Sense natively detects those devices the estimated devices become actual devices.
- Don’t start the clock ticking on Sense machine learning and detection too soon. This step can take up to 48 hours to finish, but I often see new users trying to sort out devices and waveforms during this period, even before their Sense is fully configured. Not all the features and capabilities will be functional or visible until after this step is complete.
- Pay special attention to the main Power Meter in the app – it is the most detailed and accurate view of what is going on in a home in real time. Other Sense views build on the data accumulated in the Power Meter, but when it comes to sorting out surprises and unknown devices, the Power Meter is the most direct view.
- Learn about other Sense Home app views and key terms, plus what they mean. The Now screen is naturally attractive to new users, but other screens like the Dashboard, Detailed Trends/Usage, Devices, Settings, Device Timeline, and Signals all provide extremely useful information. Useful terms worth learning and understanding include, house-level Always On, Always On for a device on smart plug, Standby, and Watt Check, plus details on how they are calculated.
- Be patient – Even after setup is complete, it can take a while for Sense to see enough on/off cycles to learn and detect many of the devices in a home. The amount of time it takes can be highly variable depending on device frequency of use, amount of noise in a user’s home and the types of device the home.
Once your Sense monitor has passed the Signal Check and Solar Calibration, Sense will start to learn and detect the all devices it can. This is a perfect time to do an inventory of all the electrical devices in a user’s home.
Inventory
A device inventory helps in two ways – It builds awareness for all the devices in a home, plus gives a user a very useful worksheet for sorting out what they know and what they don’t know about their energy usage.
I recommend doing a spreadsheet-based inventory that has additional columns / fields beyond those in the Sense device list. The additional fields will help users determine learning and detection strategies for each device. Users can decide on how completely they want to inventory their home, from a high level view of just the biggest consumers, to a detailed list of virtually everything that uses over a Watt of power.
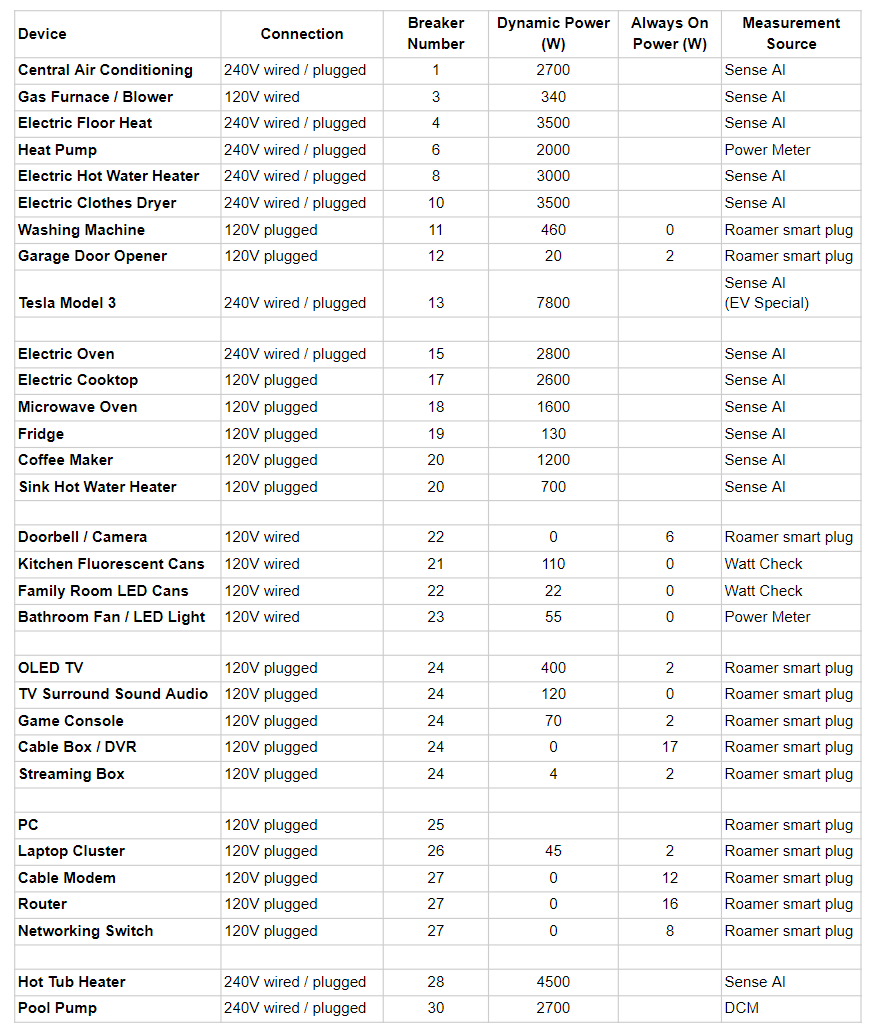
Here’s a sample starter inventory for a mostly electric home, though this is only a subset of what a home is likely to hold. This sample inventory will evolve throughout this blog to highlight how to develop a detection strategy for every device. A verified Breaker Number will help with some types of analysis and experimentation that involves turning the breaker to a specific device on and off. The Connection type information determines the best approaches for the next step in this methodology, Assessment.
One more note – Feel free to include more columns for things like manufacturers make, model and power spec, plus any other information that helps understand electrical usage.
Assess
Once a user has developed a fairly comprehensive inventory, the next step is to fill in measured usage data for each device based on techniques appropriate for each connection type, to get an overall summary of power accounting in the home. Again, this can be done while awaiting devices being learned and detected by Sense.
Sense “power accounting”
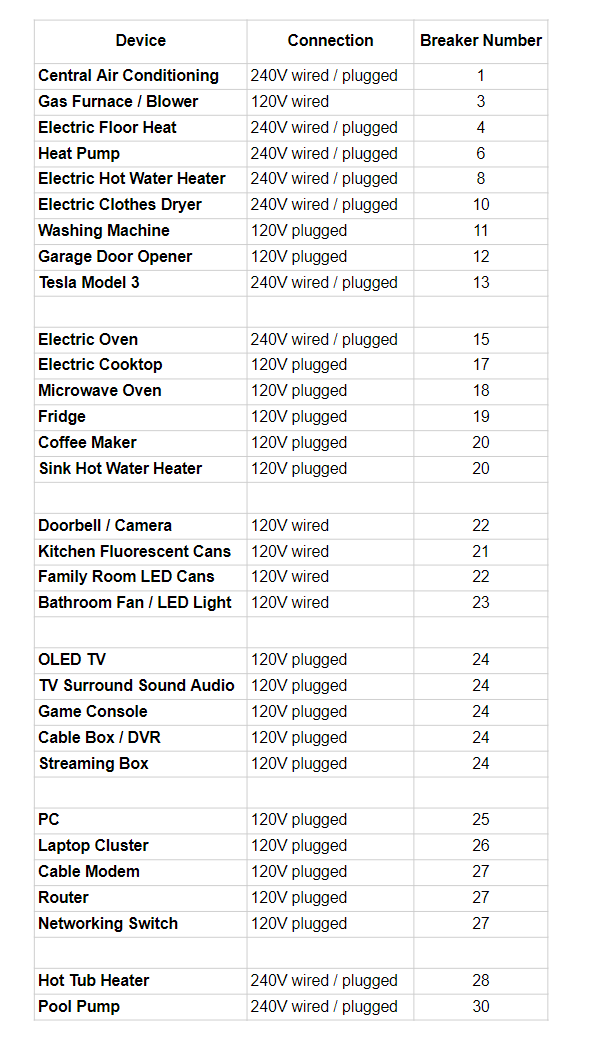
Before delving into the measurements, it’s best to first review the fundamentals of how Sense accounts for power / energy usage and the two different flavors of power usage. The screenshot below shows a real measurement using a Kasa smart plug of one of the furnaces in my house.
The main usage component, Dynamic usage in magenta, is the part that dynamically turns on and off during device operation and the component that can be “seen”, “learned” and “detected” by Sense, if the transitions meet the criteria highlighted in my previous blog. If the Dynamic power usage is learned and detected, a new device appears and it shows up in the Bubbles and on the Device List, and the energy usage over time shows up in the Trends. Even when the Dynamic power component is difficult to detect and hasn’t yet been identified by Sense AI, it can still be measured by a smart plug or one of the other approaches covered later, to give an estimate for Dynamic power the device uses, as well how often the device is on.
A second device-level Always On usage component, shown in blue (a constant 6W) powers the thermostat and the controller board in the furnace continuously. The Always On usage of any device will NEVER be “seen”, “detected” or “learned” by Sense AI, because it doesn’t have a transition. The only way to “see” the Always On component for an individual device is to use measurement techniques other than Sense AI. But Sense does “see” and calculate the Always On for an entire home using a statistical technique.
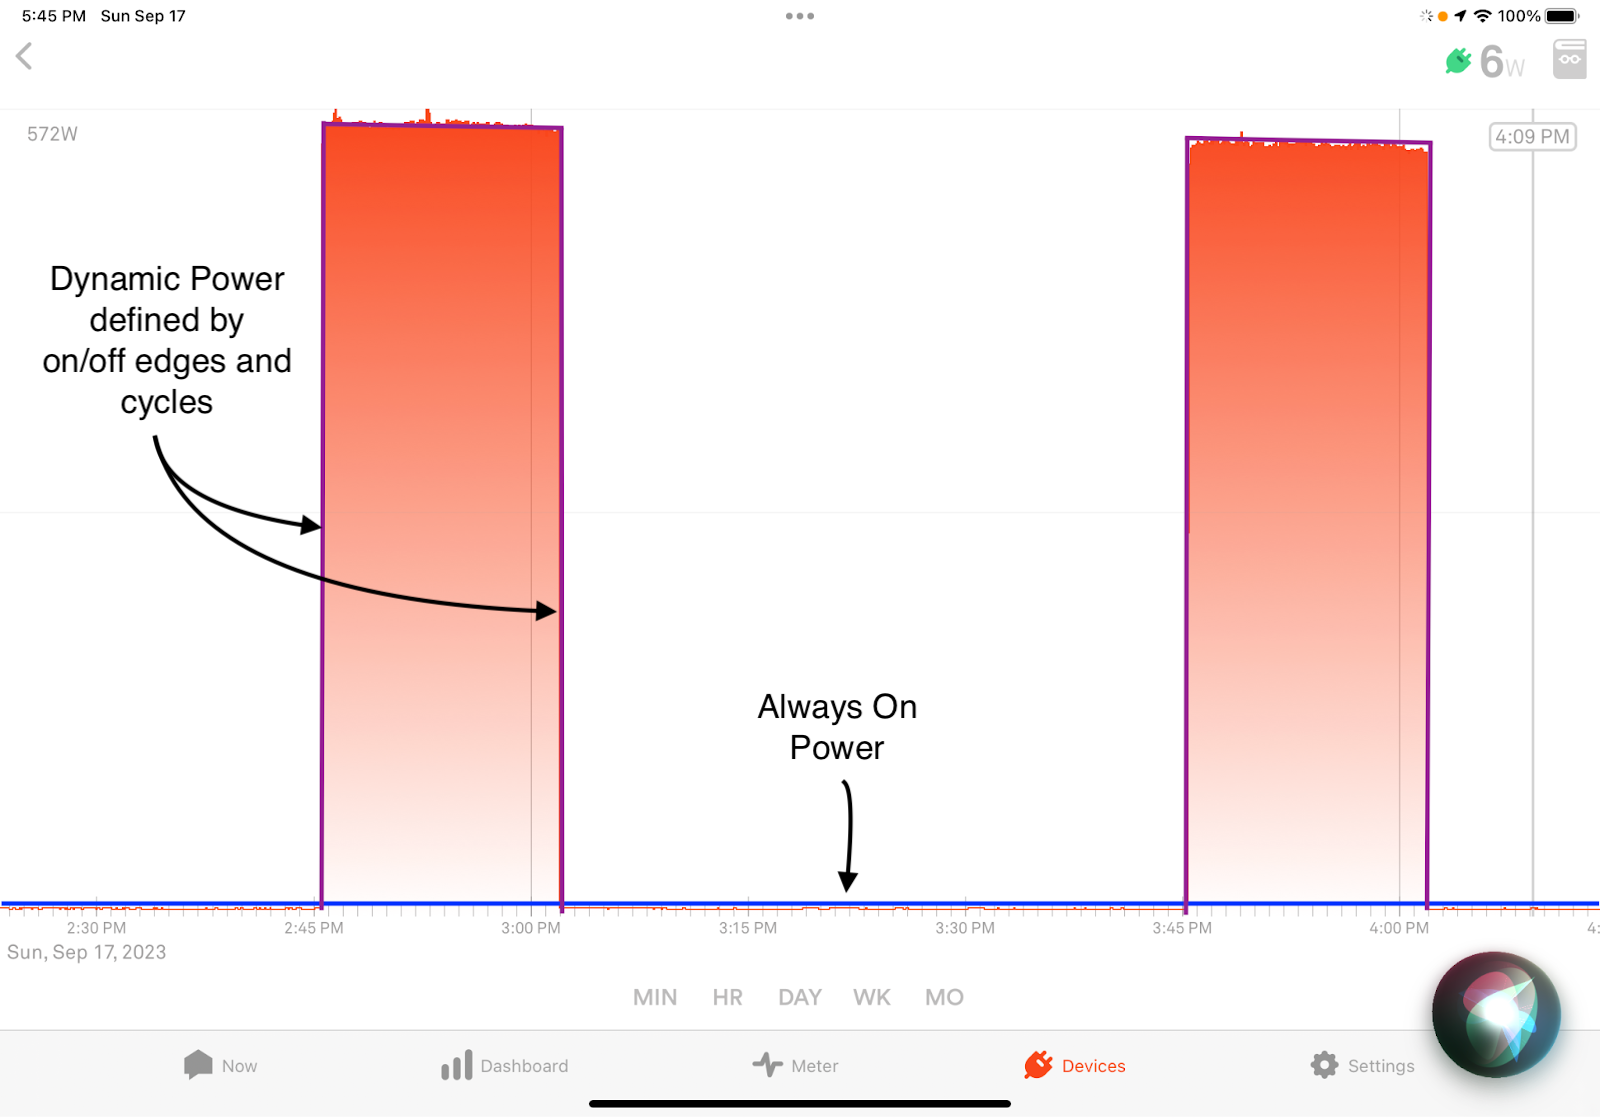
Many devices have much more complicated patterns, but it is still possible to split out Dynamic Power vs. Always On usage. The screenshot below comes from a Kasa smart plug measurement of my Office Cluster, a protected “dumb” outlet strip that powers a laptop, a monitor and 2 external hard drives in my office. It went through a whole range of power / energy usage throughout this particular day. For this day, the Always On for the cluster was 2W (Monitor and disks in sleep mode when all the laptops were removed), and the Dynamic maximum was 130W. But on a day when the laptop stays connected for 24 hours, the Always On will become 20W, unless I set the sleep mode on my laptop lower.
There are plenty more interesting smart plug-measured power usage waveforms for different devices in the Community Device Library, from OLED TVs, washers to inverter fridges, etc., that can help give you a picture of what your devices might be doing.
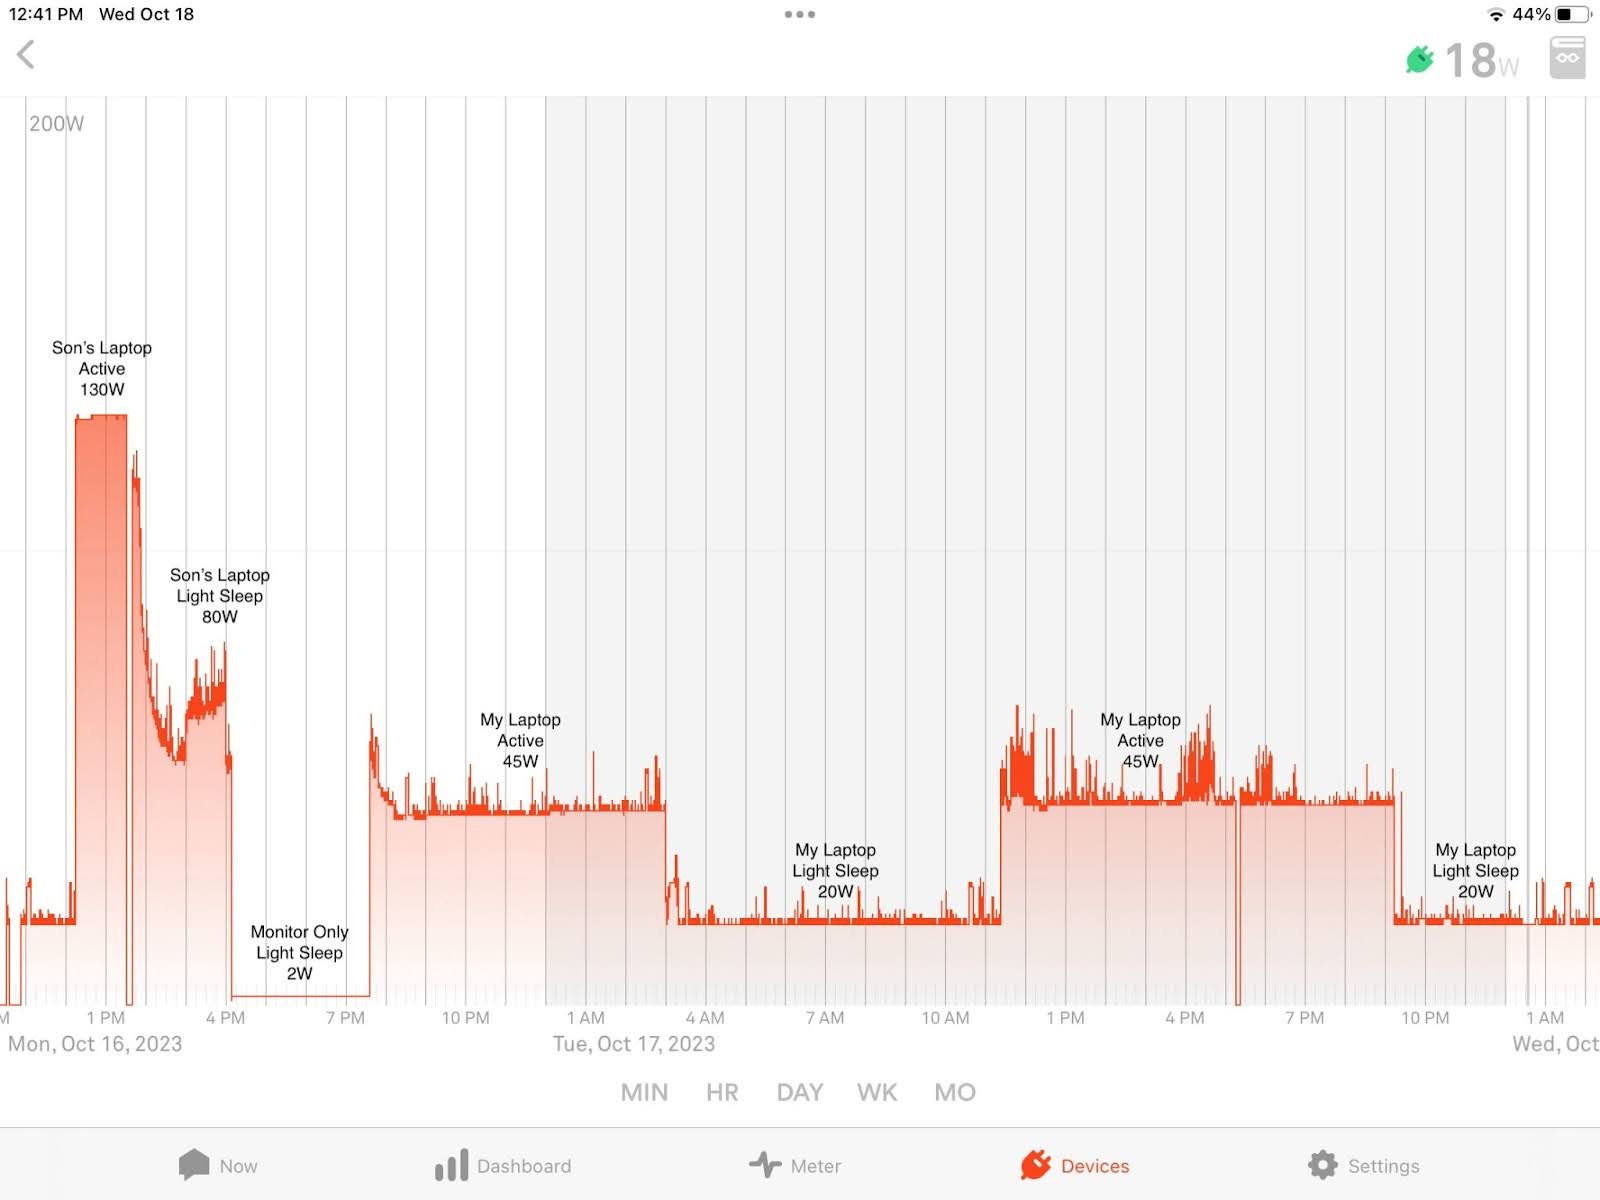
It is important to understand how both of these types of usage, Always On and Dynamic power contribute to two very different power/energy totals central to Sense. Real-time power totals are shown in the Bubble diagram. In the example below, the Total Usage (933W), on the lower right, represents the sum of all the bubbles, including the Dynamic power of all the detected devices, plus the Always On for the whole house (459W), plus the Dynamic power of all the remaining unknown, undetected devices represented by the Other bubble. Other is calculated by Sense. I should also note that some of the bubbles in the screenshot below stem from Sense AI, but others represent smart plugs that I have previously deployed.
So to summarize, Sense has two “ledgers” for power/energy accounting, both of which guide a user on how energy is used in their home , Dynamic and Always On usage. Users will need to look at both of these, and associated device-level itemizations, when they want to understand and manage their overall energy usage.
Sense Tools for Measurement
Beyond Sense AI, Sense offers some additional integrated tools and capabilities for doing usage measurement and assessment. All of these are useful and important tools for doing a complete assessment.
- TP-Link Kasa Integration – One essential tool for the assessment phase is one or more “roaming” Sense-compatible smart plugs, that offer detailed power measurements to Sense for virtually all plug-in 120V devices up to their limit of 15kW. I tend to prefer the TP-Link Kasa KP125s because they are compatible and inexpensive. Be careful NOT to buy the non-compatible “Matter” versions of Kasa smart plugs, including the EP25 V2.6 version or the KP125M, Also beware of Amazon and other websites offering alternative Kasa devices that do not measure power, and are therefore not Sense compatible. More on the usage of the “roaming” smart plug(s) in a bit. A smart plug paired with Sense can measure both the Dynamic power usage and Always On power separately for each device that is plugged into it.
- Sense’s Main Power Meter – The real-time Power Meter is a great tool for measuring the on/off usage of most switched devices, from lights, to simple motors, to heating devices. Just switch them on, then off on the device, wall switch or even at the breaker box, and measure the resultant on and off transitions in the Power Meter. Just to be clear, this measurement approach might not be helpful for devices that have more complex power usage, that either varies through cycles (washing machines and refrigerators), is highly variable (appliances and HVAC with variable speed motors and most electronics), or primarily use Always On power (networking gear). The Power Meter will only really show you dynamic power.
- Watt Check – Watt Check is a new Sense feature for measuring usage of lighting in your home. Watt Check essentially automates the measurement process in the previous bullet for most lighting devices. This is especially useful for wired lighting, where one cannot use a roamer smart plug. Watt Check will only provide Dynamic Power.
Making the Measurement
The route to measuring each of these values varies by how the devices are connected, and by Sense tools available to do the measurements.
- 120V plug in devices – are the easiest to measure. Simply set up the smart-plug using the documented setup process, and name it Roamer1 (or whatever one wants). Then connect every plug-in device in the inventory list to the “roaming” smart plug(s) for 48 hours or so, to measure both of these values. Some outlets and plugs might require one to use a short 3-prong extender – I had to use the extender to measure my dishwasher, my furnaces, and my doorbell transformer. After 48 hours, one can obtain the Always On value from the Always On device list and can extract the Dynamic Power from the Device Power Meter.
- 120V wired devices – If a wired device or set of devices (i.e. ganged can lighting) has an on/off switch one can measure Dynamic Power using the main Power Meter, or Watt Check if the devices are lights, and assume that Always On power is close to zero. 120V wired devices, that occupy an entire circuit breaker circuit (i.e. alarm system / smoke detectors, some furnaces, etc.), can often be assessed by flipping the breaker and watching the result in the Power Meter, but those results can be suspect if the breaker on/off switching cycle is different than an operational on/off cycle.
- 240/220V wired / plugged devices – Just like for 120V wired circuits, one can also use manual Power Meter approach to by flipping either the on/off switch, turning on via a thermostat for AC and Heat Pumps, starting a charging cycle for an EV, or flipping the breaker. Some devices like EVs and AC condensers might take a bit of time to ramp up to full usage, so it is critical to watch the Power Meter carefully, when the rest of the electrical activity in your house is low, to obtain the best measurement.
Logging the Measurements
By the time a user has completed this level of assessment, Sense will have likely begun learning and detecting some of the devices in their home. That results in an inventory that looks like this:
Deploy
Now it’s decision time. Given the detected devices, plus some level of knowledge of what to expect from my previous blog, users can make informed decisions about deploying a set of permanent smart plugs. Users only need to deploy smart plugs on devices that are NOT detected by Sense AI AND have reasonably high Dynamic Power usage over time. Always On usage for a device typically stays the same, so once it has been measured, that static value can be manually added to the Always On list. The general rule is to ONLY deploy smart plugs on devices that are:
- Not likely to be detected by Sense AI (or haven’t been detected by Sense AI)
- Mostly Dynamic Power usage and fairly significant – I typically use 50W Dynamic Power as my threshold.
- NOT mostly Always On usage – very common for many electronic devices.
- Deploy smart plugs on the largest Dynamic 120V plug-in devices that haven’t been detected yet and are unlikely to be detected. Users can roughly estimate the largest users by multiplying the Dynamic Power by the amount of time a device typically spends running during the day. Start with a few and add more as needed – Sense originally had a limit of about 20 outlets, but that limit has been lifted and some pragmatic users now run with 30-40 smart plug outlets.
Only use the Kasa HS300 6-outlet individually metered power strip if you have large Dynamic loads on each outlet and you want to be able to keep them separate. In many cases, a set of coordinated devices, like a PC/laptop, monitor and printer, might only need a single smart plug connected through a “dumb” outlet strip.
Tune
A month or two after deploying the smart plugs, it’s time for a little more analysis to see if additional tuning is needed. Typical tuning steps include:
- Updating the inventory measurements to include any new Sense AI detections.
- Reviewing usage of all devices on smart plugs that also have Sense AI detections. Redeploy any smart plugs that are providing redundant data due to new detections.
- Adding other Sense Integrations to measure Dynamic usage or devices in the inventory that have not been picked up by Sense AI.
- For any wired lighting, especially in-ceiling cans, consider using Hue bulbs and the Hue Integration. This requires the purchase of a Hue Hub plus somewhat pricey Hue bulbs, but gives you much more control over power usage and color of your lighting, as well as informing Sense of bulb power usage.
- A second option for wired lights would be to install Wiser/Square D X series power monitoring switches for lighting as needed. The Sense Wiser Integration will provide Sense with power information from these switches.
- For HVAC / Air Conditioning devices, consider swapping your existing thermostats for Ecobees, if possible. They are pricey, but worth it from my perspective. Not only do they provide far more programmability, automation and data access than most other thermostats (Nest included), but they also provide HVAC feedback data directly to Sense, which enables Sense data scientists to better model your HVAC system. I have seen really good improvements in correlation results from Sense detection vs. Ecobee runtimes from a few users. That tells me that the Ecobee Historic Integration is working.
- Add Flex Sensors / Dedicated Circuit Monitoring (DCM) for any large 120V or 240V wired loads. Sense offers add-on Flex Sensors that connect into the second port on the Sense monitor and enable DCM (dedicated circuit monitoring), if a user is not already using the second port for solar. These additional sensors can give dedicated visibility into two 120V and / or 240V circuits in the breaker box.
- Another powerful and sophisticated tool that can help users improve their understanding and control of home energy usage in conjunction with Sense, is Home Assistant, a free open-source home automation platform that runs on a variety of hardware. I’m not going to go into all the capabilities of Home Assistant(HA), but here are a few key capabilities for Sense users.- Off-the-shelf integration with Sense so pretty much data from Sense can be streamed into Home Assistant
- Dozens of unidirectional and bi-directional integrations with smart everything – switches, outlets, appliances, power monitoring devices, EV chargers, etc.
- Off-the-shelf reverse integration with Sense called SenseLink, that enables users to program HA to send power usage information for devices back to Sense, similar to Kasa smart plugs.
- Automated, programmatic control of smart devices with integrations
- Detailed, programmable queries of energy usage data and associated customized dashboards, either in Home Assistant, or using an add-on InfluxDB / Grafana environment.
The End Result
Users that follow these 5 steps should see three useful results out of their efforts:
- A much better understanding of where all electrical energy goes in their home, through a measured home inventory.
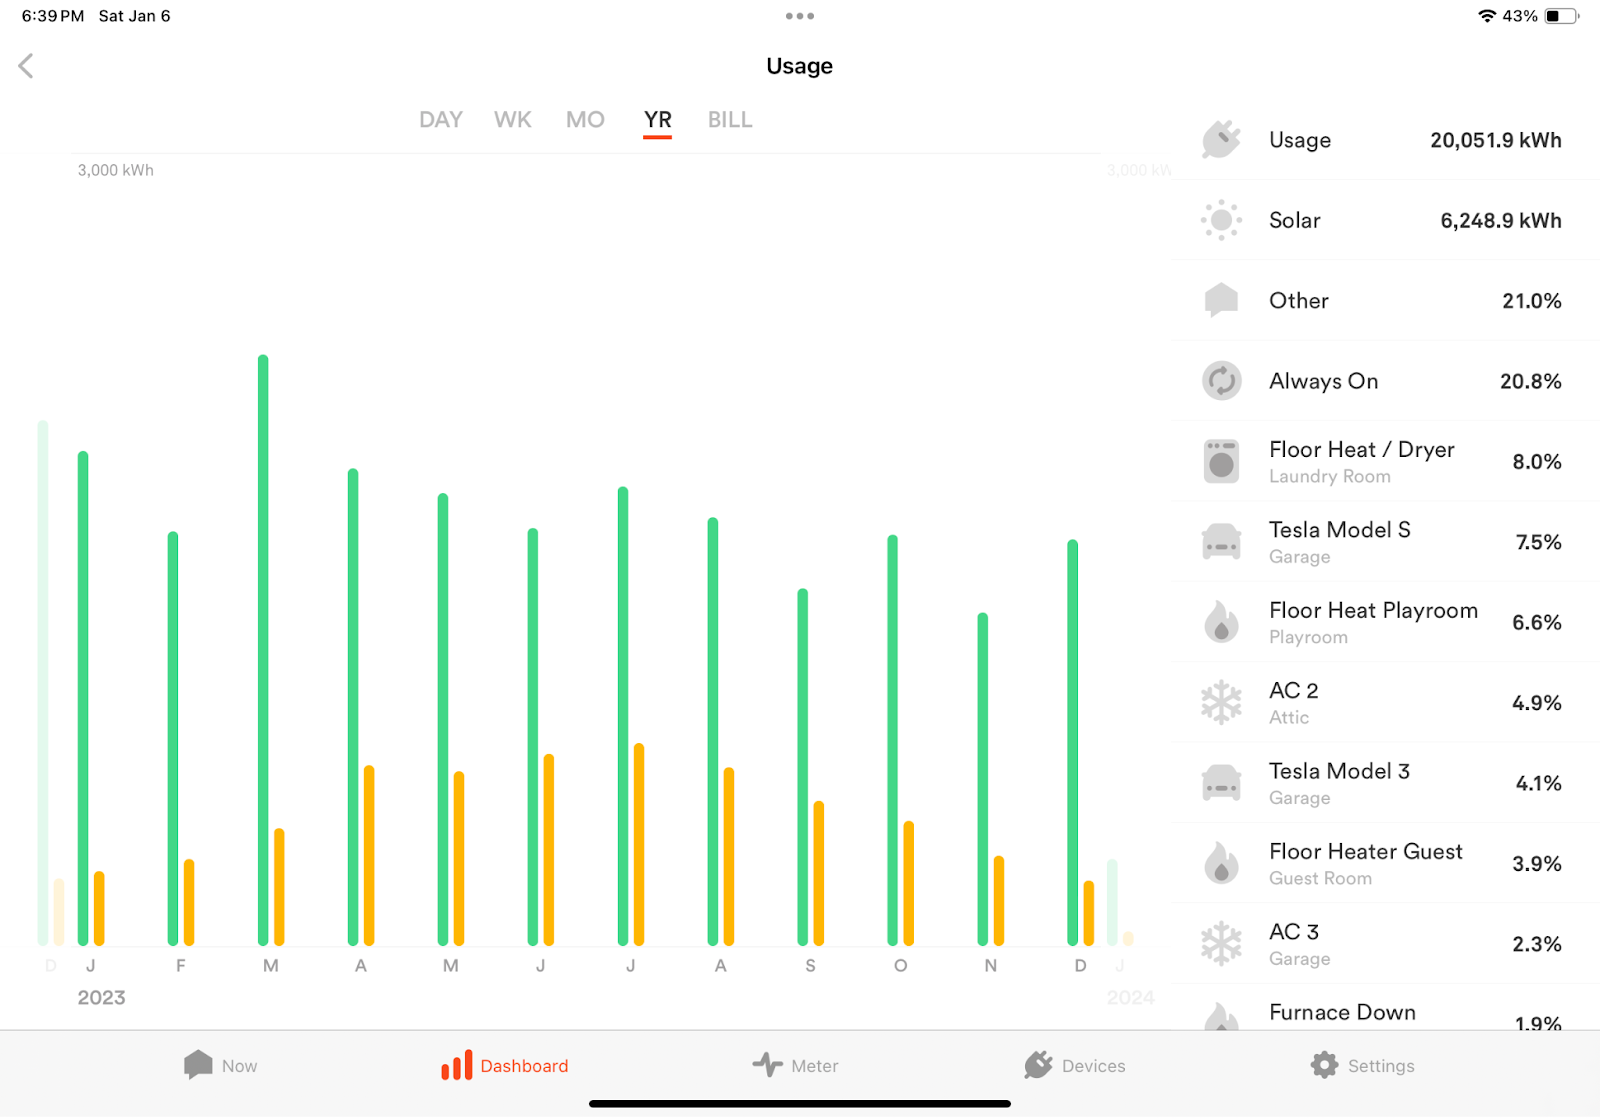
- A smaller Other thanks to judicious use of smart plugs, DCM and other integrations. Below is the Sense Usage summary for my house for 2023. Only 1 of the top 10 usage items come via smart plugs. And my Other is typically around 20-25%, down from 55% several years ago thanks to this methodology.
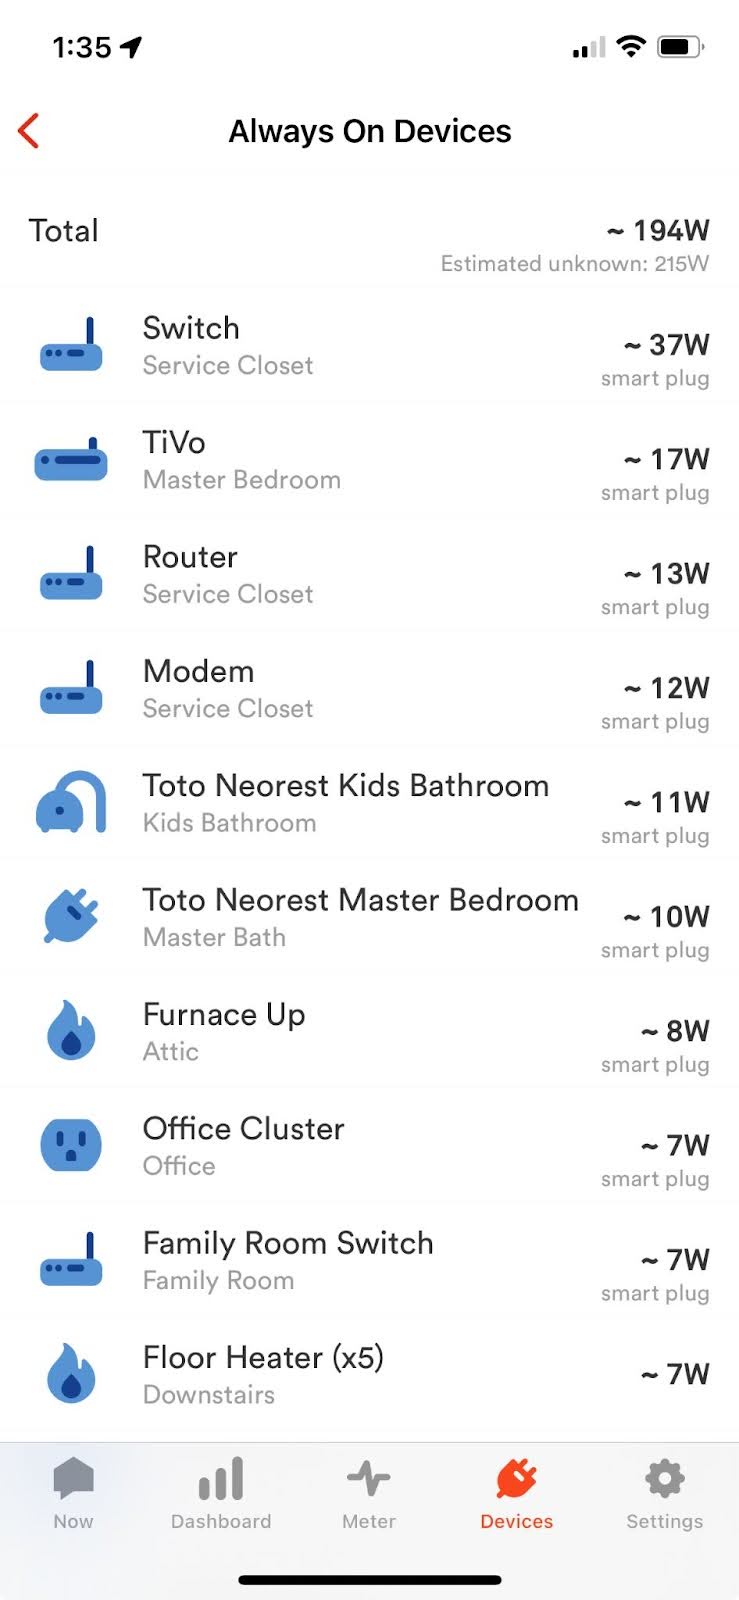
- A nicely itemized list of Always On usage for their home. Here’s my Always On inventory, with a mixture of smart plug and manually added Always On values. You can see my “Estimated unknown” Always On is down to 215W, in the small gray text below the ~194W Total of itemized Always On sources.
With a little extra effort and accounting, plus a few additional smart plugs, Sense users can expand their understanding of their home’s electrical usage. Feel free to message me via the Sense community at @kevin1, if you have any other techniques you use to assess and reduce your Other.
About the Author: Kevin Kranen is a longtime Sense user (6 years!) and volunteer moderator of the Sense Community. He has experienced the successes and, sometimes, frustrations of Sense users over the years. His knowledge, enthusiasm, and impartiality make him the ideal candidate for a series of stories on what users can expect from Sense, both good and not so great, plus processes and techniques for new and intermediate users to get even better results. We’re excited to bring you his perspective and expertise.
The post One User’s Method For Getting The Most Out of Sense appeared first on Sense.
]]>The post Introducing Watt Check for Lights appeared first on Sense.
]]>How to Use Watt Check
First, it helps to pick a time when your home is electrically “quiet.” That is, when there are no high-powered devices like a microwave, oven, or washer and dryer running. A quick look at either the Now or Power Meter screens will save you a trip around your home. A flat Power Meter is a good start.
- Navigate to the Dashboard tab and scroll past the Compare card. Tap anywhere on the Watt Check card.
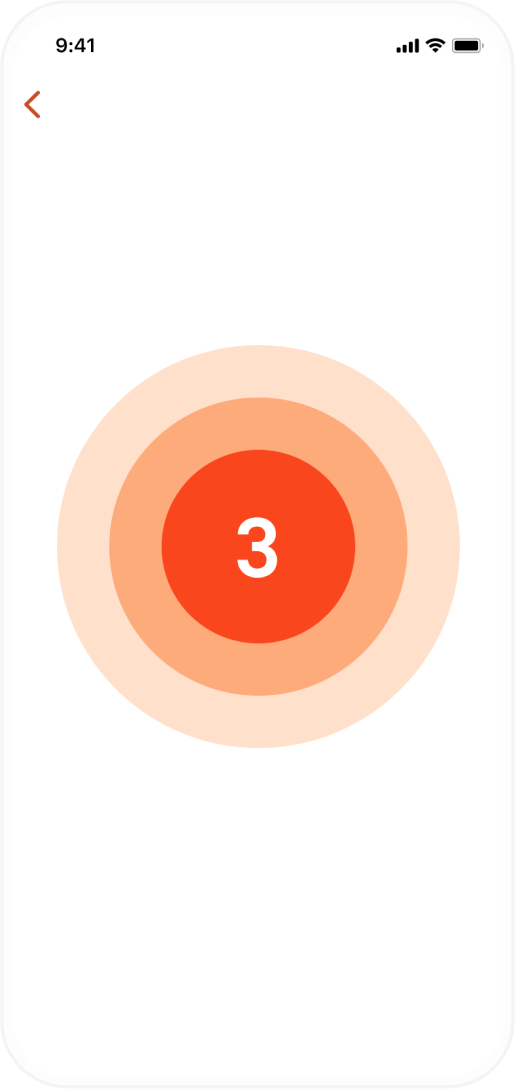
- Pick a light in your home and be ready to turn it on. Once you are, hit the Get Started button to start the countdown.
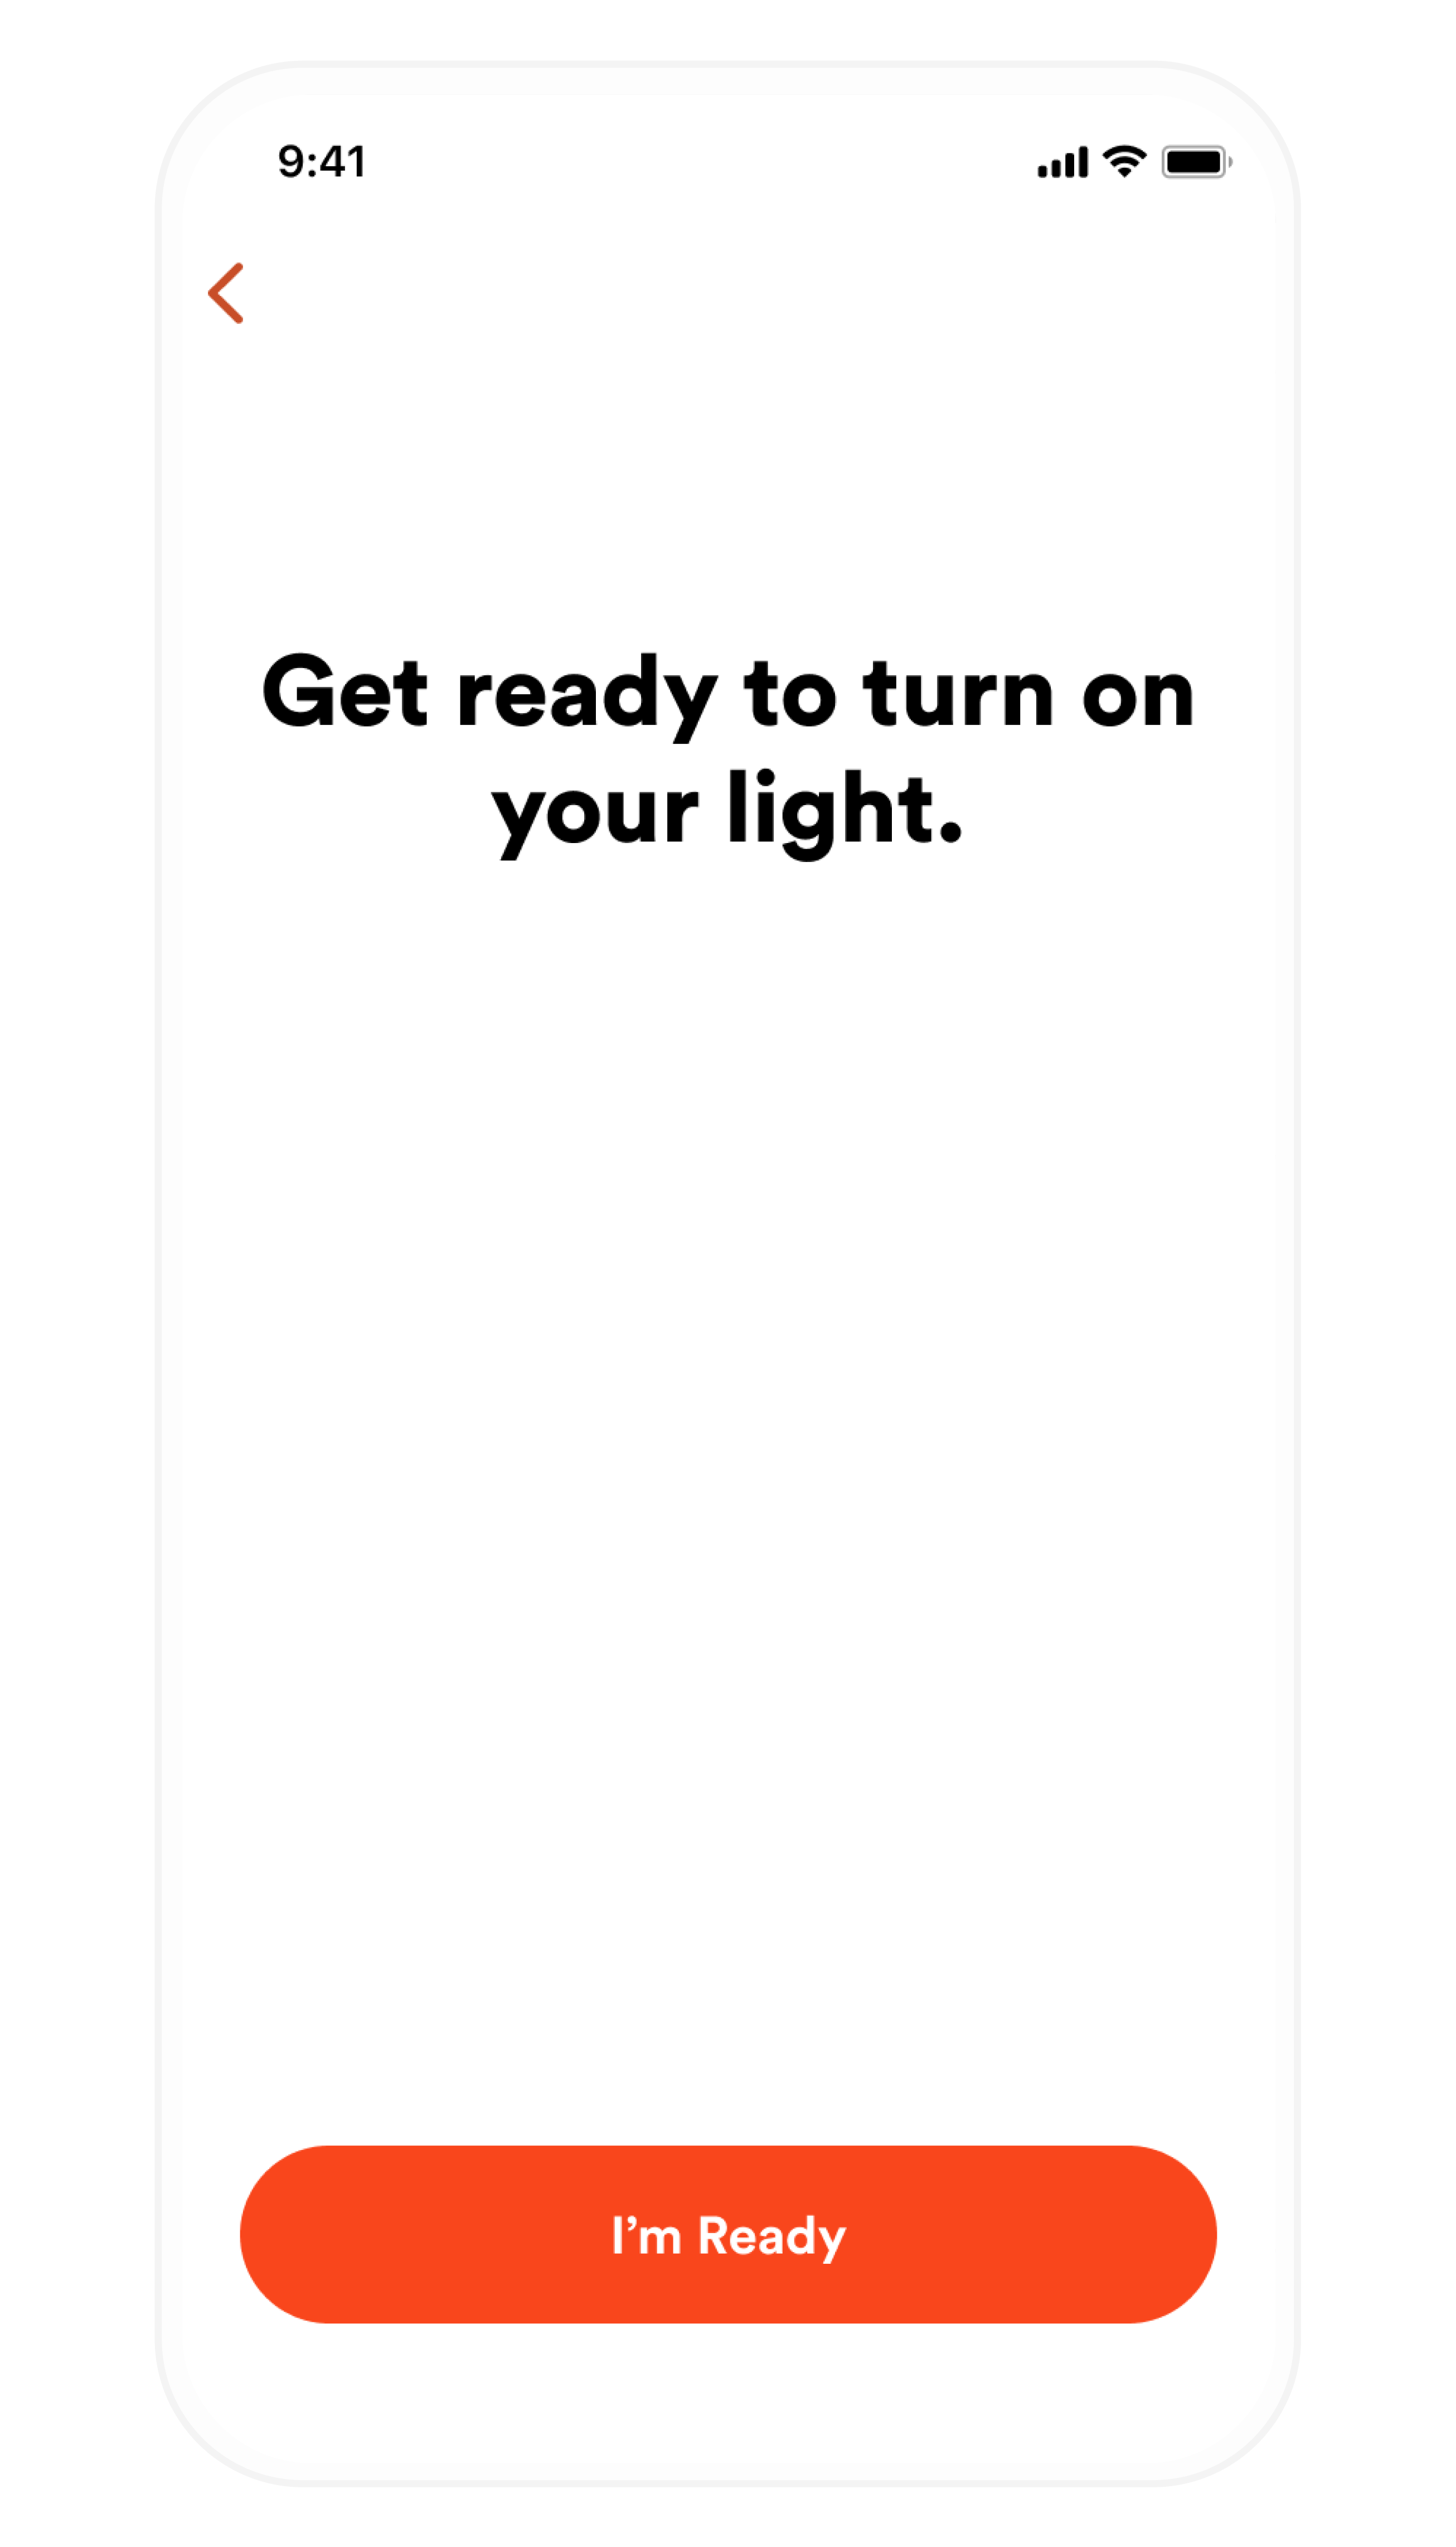
- Wait for the countdown, then turn on the light.
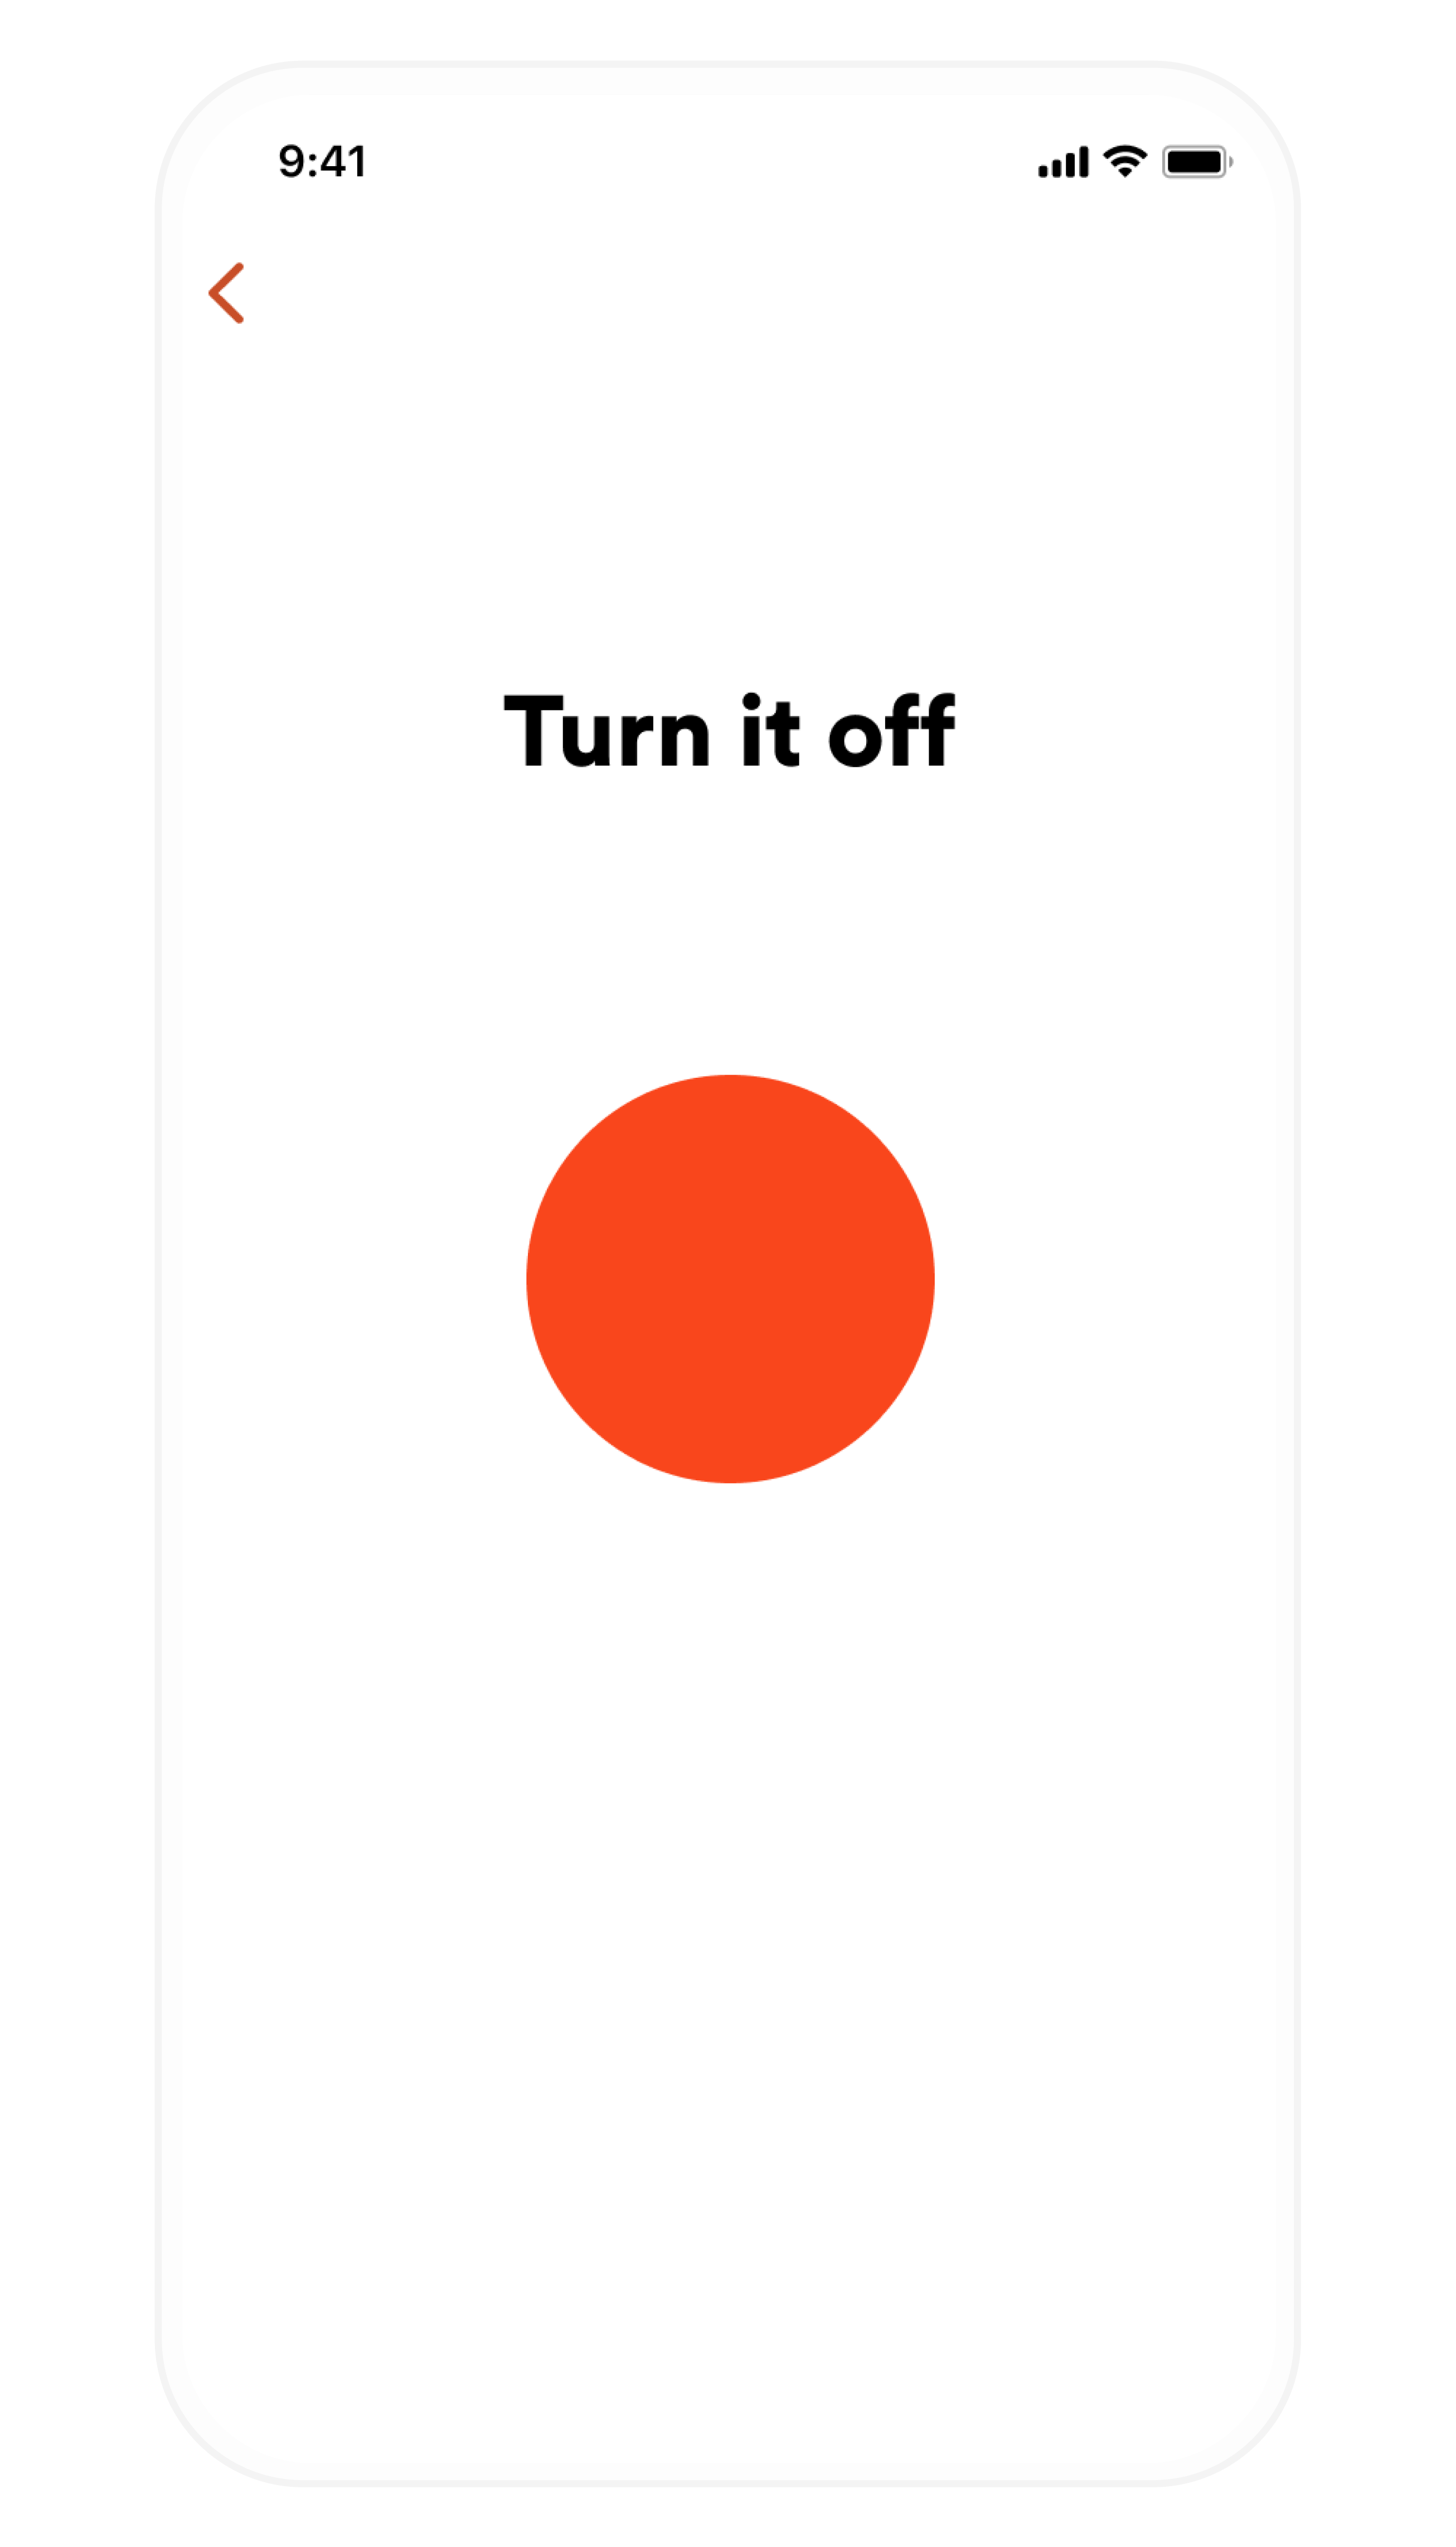
- After a few seconds, another countdown will appear, prompting you to turn the light off.
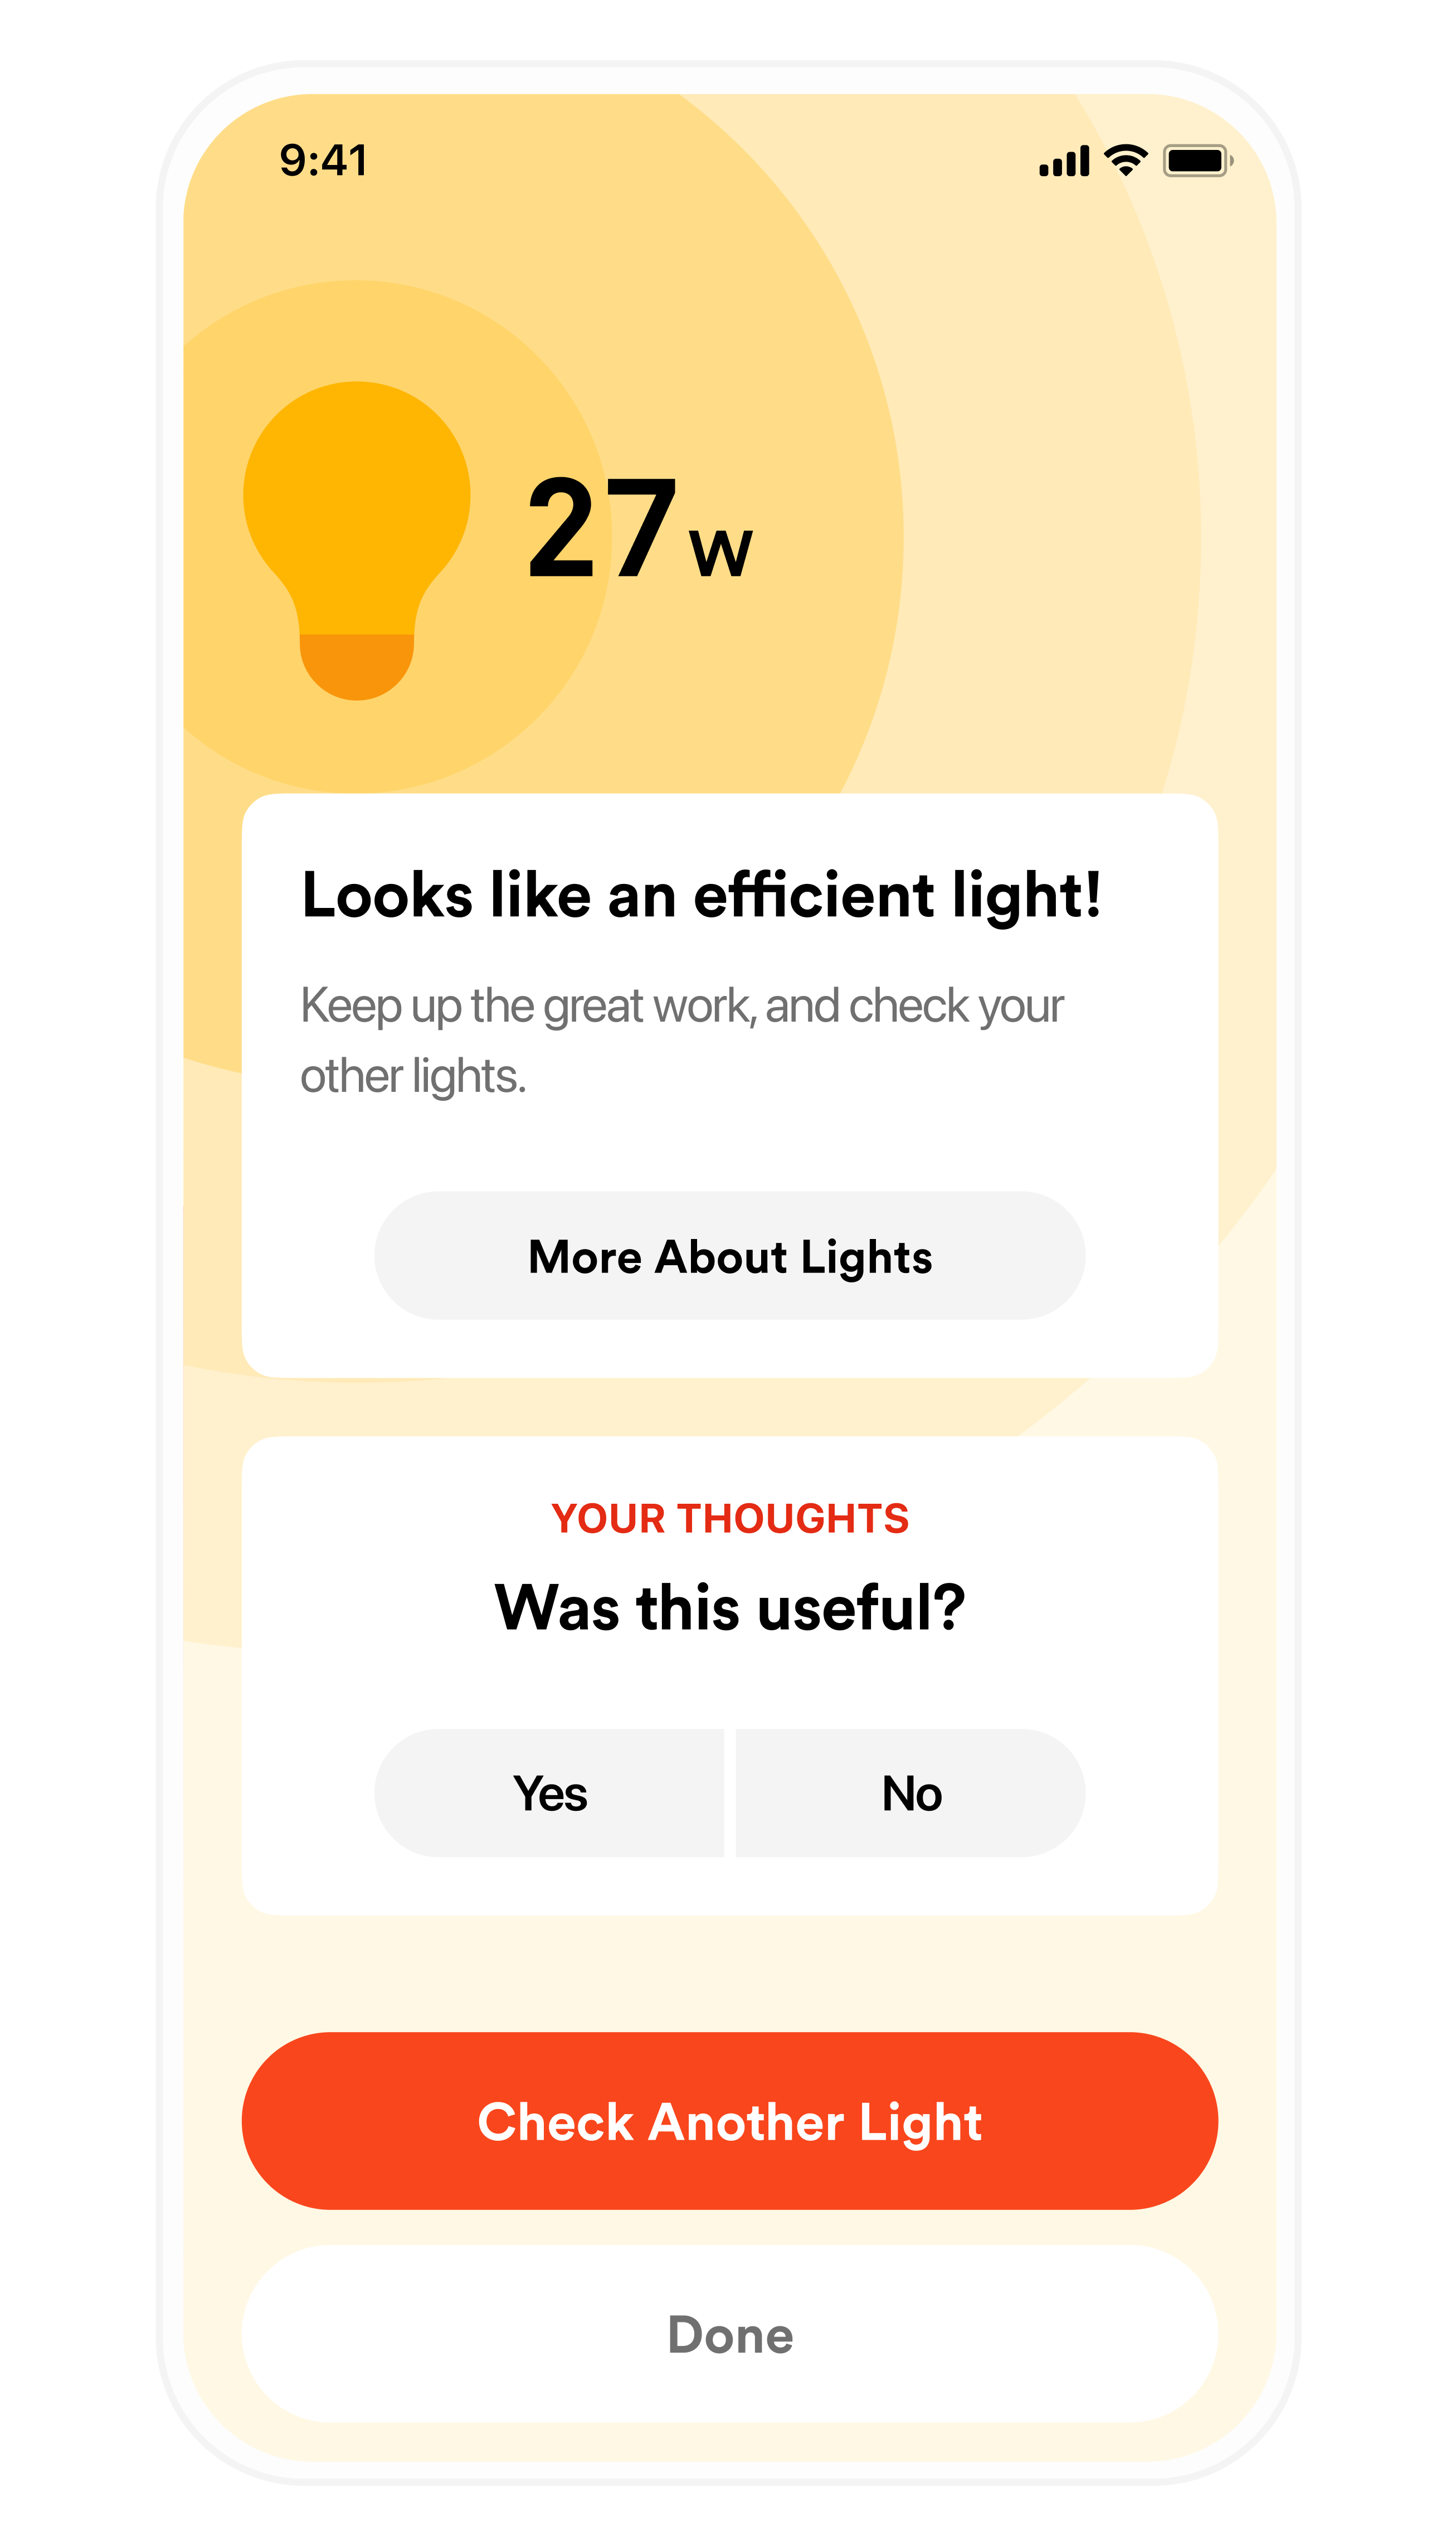
- See the results. Sense will have measured the change in wattage from before and after the lights turned on and off to provide an assessment on how efficient your lights are.
If you get a screen saying the results are inconclusive, run the steps again or check to make sure that other devices in your home are turned off.
To see a video of Watt Check in action, scroll down to the video below.
Reading the Results
Sense can’t know if a bulb is LED or incandescent, but since the wattages vary so greatly we (and you) can make inferences about the types.
If you measured one bulb, and it uses more than 60W, there’s a good chance that it is an incandescent bulb.
If you measured a set of recessed lights, say 6 bulbs, and Sense measured them at 48W, you can be confident they’re LEDs.
The feature will also estimate the cost of using those high-bulbs if you’ve input your electricity rate. If you haven’t, you can find this under Settings > Electricity Info.
Opportunities for Saving
Go around your home, room-by-room and check all your lighting. Start with rooms and lights you use most frequently. Areas where there might be old bulbs and the biggest opportunity for saving are the hard-to-reach places. If you do need to replace incandescent bulbs with LEDs, consider that Sense integrates with Philips Hue light bulbs, which have programmable scheduling, with Sense tracking the wattage and history of those bulbs in the app.
We hope you enjoy this new feature. If you find it useful, let us know with a review at the Apple App Store or Google Play Store.
The post Introducing Watt Check for Lights appeared first on Sense.
]]>The post What to Expect When you are Expecting (Detections) appeared first on Sense.
]]>Better Expectations = Better Understanding = Better Results
We all do better when we know what to expect from a new technology. Sense can be a helpful tool for everyone, but every home is unique and device identification may vary depending on a variety of factors, which I will go into detail about here. Sense users should be aware up front that there are some types of home devices that Sense will intrinsically be good at learning and subsequently detecting, but other types of devices are far more challenging for Sense to learn using what I refer to as “native detection”, Sense’s main artificial intelligence (AI) approach to identifying devices. But that’s not the limit of devices Sense can “detect” – Sense offers a whole range of additional capabilities and integrations that enable users to “detect” many devices outside the ones that are “learned” by the current Sense AI approach. When set-up and managed with a little bit of intelligent methodology, Sense can deliver a very complete view of energy usage and management in your home.
To start, here is a general list, based on my experience, of what you can expect Sense to identify and what it is likely to miss, using native detection (Sense AI). The list is not exhaustive, but covers many typical devices in a home:
Likely to be learned and detected over time using Sense AI
Devices with relatively fast, unique pairs of On/Off transitions (more on this later).
- Dryer heating elements
- Clothes washers and dryers that use AC motors – newer ones use DC motors
- Oven heating elements and range heating elements
- Many kitchen appliances – dishwasher heating elements, trash compactors, coffee makers, instant hot water heaters, traditional (non-inverter) fridges.
- Incandescent and some fluorescent lighting – some users even see Sense detecting low wattage lights inside the refrigerators.
- Some printers, including laser printers with heating elements
- Vacuum cleaners and motorized plug-in tools
- Simple single-stage central air conditioning (AC) units
- Several more common battery-electric vehicles (BEVs), depending on make and model
Unlikely to be learned and detected with today’s Sense AI Detection mechanism
Devices that don’t meet the “relatively fast, unique pairs of On/Off transitions” set of conditions.
- TVs, audio receivers, AV components, streaming devices and DVRs
- Computers – laptops and desktops
- DC and variable speed motors – many pool pumps, inverter fridges, newish appliances and battery backup garage openers use these, instead of AC motors.
- LED lighting (except for Philips Hue) – I have seen some LEDs detected, but usually in homes that have a very low activity level of other devices.
- Variable-speed or multi-stage heating, ventilation and air conditioning (HVAC) systems, including heat pumps known as mini-splits, though Sense has been slowly improving in this area
- Variable speed pool pumps
- Hybrid electric vehicles and less common electric vehicles (EVs)
What Makes a Device Likely to Be Detected ?
Sense AI Detection was designed to provide users with real-time feedback about what is on and off, a really useful and cool feature. The Sense Bubbles pop up within 1-4 seconds of a device turning on and disappear when the device goes off, even when many other devices are going on and off in a house, in the background. That means the device has to fit specific characteristics to first be “seen”, then “learned” by Sense.
- On and Off Transitions vs Constant Power Usage – A device must actually produce on/off transitions, otherwise there is nothing for Sense to “see” from a home’s power mains. My furnace fan, below, offers nice, clean on and off transitions and is a good example of a device that will be detected.
[]
In contrast, many electronic devices, like routers, modems, don’t have real on/off transitions. We just plug them in and they turn on and operate at a fixed power level, with maybe a tiny bit of rippling of the power usage. It’s impossible for Sense to “see” Always On usage, like this, at a device level, when observing house-level power usage. There’s just nothing to look for or see when the power usage is constant. A good example is my cable modem waveform below, courtesy of a Kasa smart plug.
- Fast Transitions – The device’s on and off transitions also have to be quick enough to offer real-time detection, within about one half second from fully off to fully on, or vice versa. Devices can NOT have a complex, multi-second on or off ramp-up / ramp-down pattern. Many BEV chargers take many seconds to ramp-up or ramp-down, so Sense has created special make/model specific detectors for those, but otherwise devices need to have sharp on/off transitions, or they won’t be “seen” by Sense. The furnace fan, highlighted earlier for clear transitions, also exhibits sufficiently fast transitions, when zoomed in to the highest Sense magnification.
![]()
In contrast, the power ramp-up of a level-2 electric vehicle (EV) charger is much larger in magnitude, but slower. Below is a Tesla Model 3 on a high power wall connector (HPWC) measured by dedicated circuit monitoring (DCM). As previously mentioned, Sense is able to detect some BEV charge cycles, but that uses special techniques, not the standard Sense AI discussed in this blog.
- Unique Transitions – The device’s on and off transitions have to be somewhat unique among all the devices in your home, yet similar enough to each other on each repetition, that Sense can group them together. I won’t go into all the physics details, but this typically means that a device’s power transitions must stand out against all the other transitions going on in the background in the house. Those background transitions, also known as “noise” can vary greatly from home-to-home and are one of the reasons that a specific device can be detected in one home, yet cannot be detected in another.
Once again, I’ll bounce back to my furnace fan to highlight what fast and unique transitions look like.
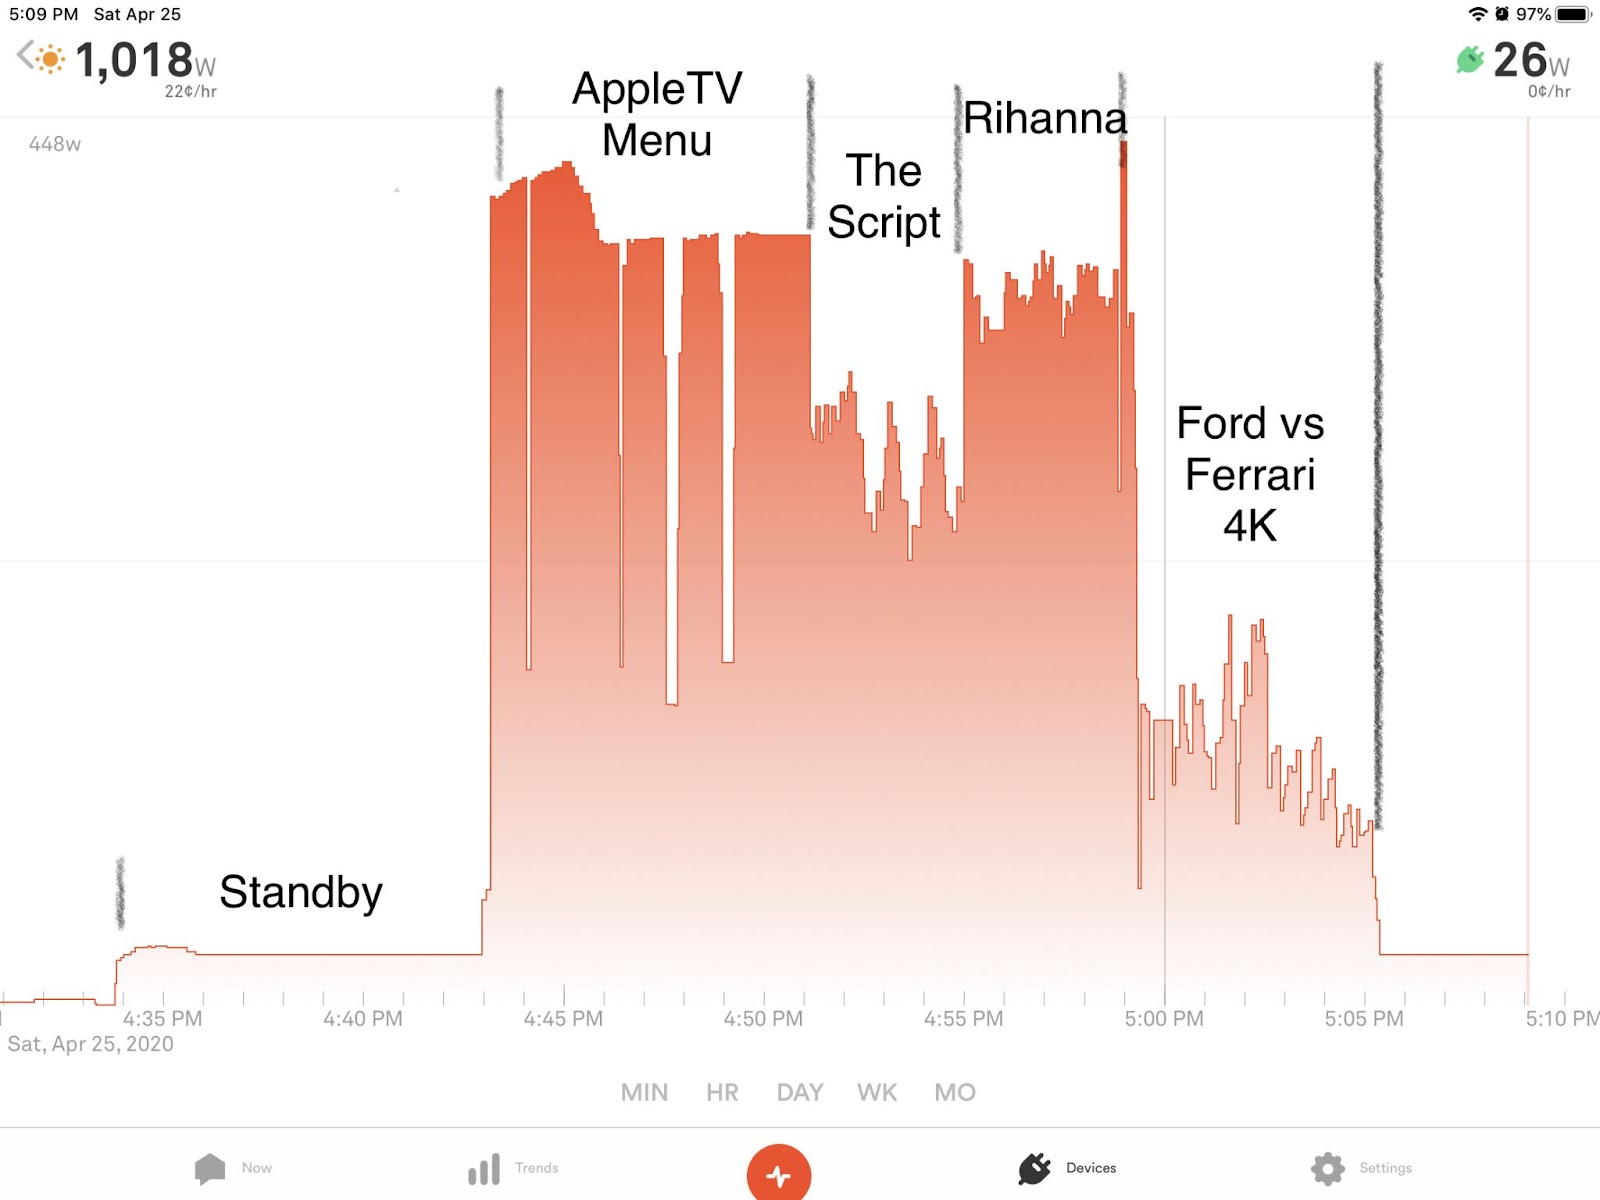
Here’s the opposite – a large-screen OLED TV. The TV generates tons and tons of variously-sized transitions, none of which uniquely match the transitions when the TV is actually turning on or off. With the TV, transitions can occur frequently and mostly relate to what theTV is displaying in the moment, though sometimes even static patterns (i.e. the Apple TV menu) can generate big transitions. You can read more about evaluating the power usage of an OLED TV here.
- Pairs of On and Off Transitions – Sense won’t “learn” a device, then subsequently “detect” it unless Sense can spot pairs of matching ons and offs in Sense’s accumulated transition data. The furnace fan above provides consistent, matchable pairs of fast and unique transitions. It’s also pretty clear that the OLED TV example, above, does not, even when you look at just the on and off transitions (and not all the other random transitions in between).
Beyond Detection
Even if devices are well-behaved and are learned by Sense, there can still be challenges when it comes to sorting out detections and identifying them as a single device. Some of the complicating factors are:
- Multiple Pairs of Transitions – Some devices might produce more than one set of on/off transitions that are different from one another. For example, an oven range-top typically has multiple settings, each of which will have their own power levels (hi/med/low). A refrigerator can have multiple motors (for cooling compressor and icemaker), a heater (defrosting element) and a light that all go on and off independently. These multiple pairs of on/offs will be “learned” as different devices by Sense. The Sense Home app offers a merge function that combines multiple detections into a single device. Here are a few more examples of multiple on/off detections that can live inside a single home device.
- On/Off Transitions plus Always On – Many devices use BOTH constant Always On power, plus have distinct on/off transitions. For example, a furnace requires constant power to keep the control board inside it running, and to provide power to the thermostat(s) connected to that furnace. That constant electronic power usage won’t be visible to Sense because it is essentially Always On. But when the blower fan turns on and off, Sense will typically detect those fan-on and fan-off transitions as a Motor device.
- Conflation – Sometimes, Sense thinks a set of on/off transitions is unique, when it is not. One example would be a house with two of the same exact model of garage door openers. Both of those motors are likely to be “learned” as a single device – device conflation. But conflated devices don’t have to be the same kind of thing – in my home, a flooring heating strip gets conflated with my clothes dryer heating element because both of them are 240V heating elements that use almost the same wattage.
- Noise – If your home is filled with many, many transitions going on in the background, Sense might have difficulty “learning” devices in the first place, because some device transitions get lost in the noise. But even after a device has been “learned” and Sense can identify it, noise in your house can cause missed detections or missed offs. Both of these noise situations can cause problems for Sense to be inaccurate. Here’s an example of a situation where noise most likely hid an off-transition of my AC from Sense.
Looking at Transitions From Your Sense Monitor’s Point of View
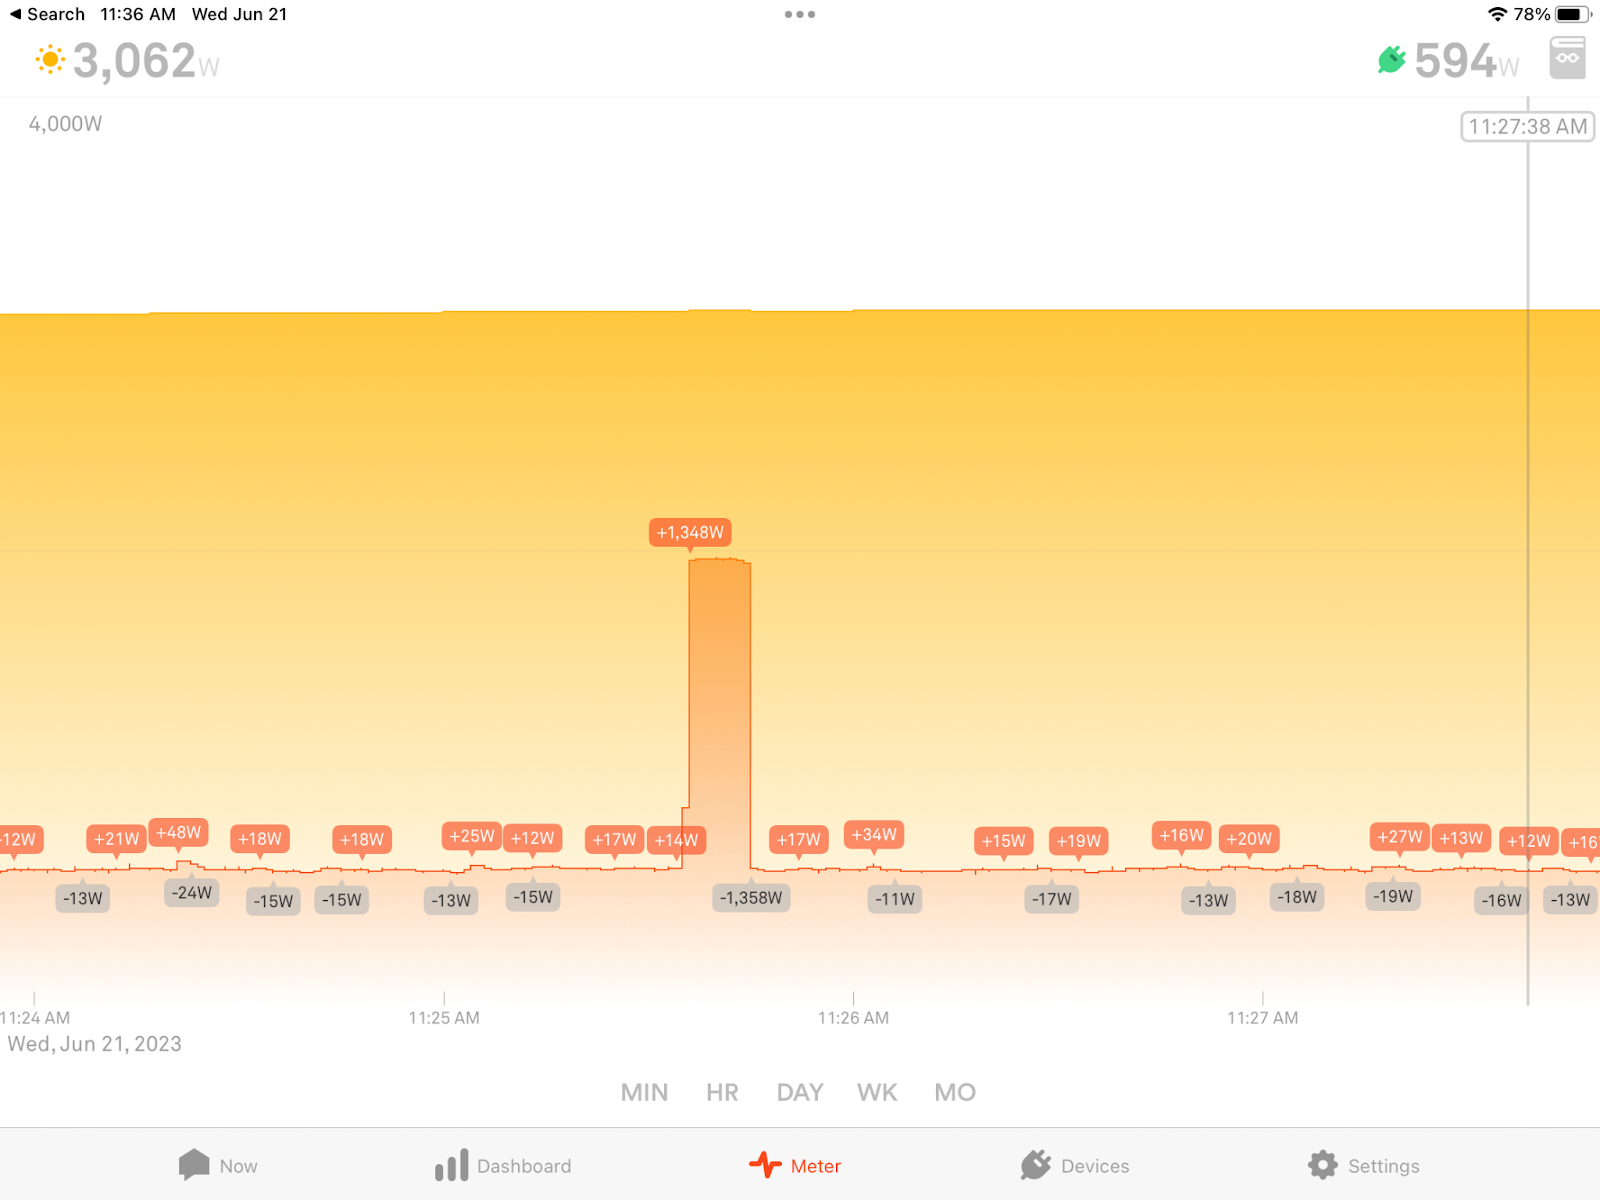
The Power Meter within the Sense phone/tablet app, shown below, is the most similar view to what Sense’s data models “see”. In the app, Sense tags transitions that likely fall into the “fast enough” category. Pairs like the +1,348W on and the -1,358W off are distinctive enough to match up and deem a detection once Sense has seen enough of them. But the dozens of smaller ones between 10W and 30W, may or may not be distinctive enough. And if some portion of those 10W-30W transitions run continuously, day and night, they can even create noise that prevents Sense from detecting other devices in that range. If a device’s ramp is too slow to get tagged, or gets tagged as a bunch of separate segments, then Sense is unlikely to detect it. The Power Meter, with its tags, is extremely useful for gaining insights into how Sense AI “sees” your home, though it doesn’t reflect exactly what Sense “sees”.
Two Special Devices – Always On and Other
There are two special devices in the Sense device list that don’t correspond to any devices in one’s home and are not directly connected with detections or measurements of devices in the house, Always On and Other.
- Always On – While Sense cannot “see” the Always On or constant usage of any single device without help from a smart plug, because constant usage doesn’t produce any transitions, Sense can calculate the constant usage or Always On for ALL the devices in the entire house. It does that by calculating the near-lowest level of usage in the house over the previous 48 hours, every half second. The two important things to understand about Always On, is that it is there to identify a type of usage that the Sense AI detection will never see, and that it doesn’t change very quickly because of the 48 hour lookback.
- Other – This device and bubble represents what is left when all the usage from detected devices that are on, plus Always On, are subtracted from the Total Usage for house as measured by Sense. Some users get confused by Other, thinking that it represents one or more devices that Sense has already detected but hasn’t been able to classify or name yet (I have seen several users in the community ask to be able to rename Other for the device they think it represents). It is just a calculated value that tells you how much energy cannot be itemized by Sense at any one point in time.
Users that understand all these concepts behind what Sense “sees”, “learns” and subsequently “detects”, plus the role of Sense special devices, can utilize a 5-step methodology (Install / Inventory / Assess / Deploy / Tune) to expand their understanding of their home usage even further and reduce their Other bubble using a methodical approach. More on this in my next blog.
The post What to Expect When you are Expecting (Detections) appeared first on Sense.
]]>The post Three Ways the Sense Home App Keeps Your Home Safe appeared first on Sense.
]]>Sense alerts you to dangers
How many times have you left the house and wondered “Did I unplug the curling iron?” Or did I turn off a clothes iron or leave the space heater running? Sense can be the memory aid you need.
In the Sense Home app, you can select a device you want to track, choose the gear icon, and select the Manage tab. You can add basic notifications (Alert me when the device turns on/off) and custom notifications like “Alert me if my iron is on for 30 minutes.” The alert will pop up in your Sense Home app to remind you. You can’t control devices from the Sense Home app, but Sense integrations with smart plugs give you that added level of control if you want it.
There’s another simple way to check on your home. In the Sense Home app, look at the Power Meter view. A hot device like a toaster or space heater typically runs at more than 1000 watts. If you know your typical home energy usage, you can see that 1000 watt spike and know when the device turned on or off.
A quick check in the app saved one Sense user who left a kiln turned on while he was on vacation. Another customer noticed a spike in usage in the Sense Home app and discovered that a freezer’s compressor had overloaded, heating up the electrical cord. The freezer’s contents were saved and a potential home fire avoided.
Sense tells you what’s on and off
Unless you have the skills of a builder, electrician, plumber and air conditioning specialist, there’s a good chance that your home’s internal operations are a bit of a mystery to you. Even more mysterious are devices that keep your home running but are hidden inside the walls or underground in your yard.
Sense can uncover some of those mysteries by tracking the electrical operation of your home. A good example is sump pumps, well pumps and septic pumps. All three of these pumps are essential to keeping your home in good working order, and if they break down you could end up with flooding into your home or no water in the taps.
Sense does a great job picking up on pumps that turn on and off regularly. By checking the Sense Home app, you can see how often a pump is running and notice any changes that could turn into messy, expensive disasters. You can also set a notification like this one: “Alert me if my sump pump is off for 30 days.”
A Sense customer in Canada used the Sense Home app to keep his well pump and septic pump running smoothly. It told him about the operation of pumps that were hidden beneath snow and earth. Another Sense customer saved himself a $200 water bill when he discovered a pump running too often.</PSense shares data about electrical issues
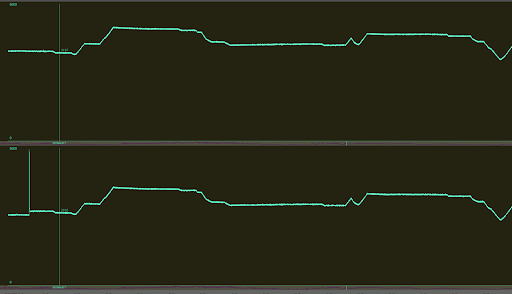
At Sense, we’re always looking for ways to make peoples’ homes work better. The Sense Labs Power Quality project measures the electricity coming into your home from the grid and identifies fluctuations in voltages outside of a normal range.
You can find the Power Quality project in the Labs on your Sense Home app. It will tell you if your electricity is experiencing dips and spikes that are outside your home’s normal range and shows a comparison of your power quality to other Sense users.
There are many reasons for widely varying power quality, including stresses on local grids by nearby large businesses. But power quality issues can also indicate an issue with the power feed from the utility to your home or the wiring inside the home. If you’re also seeing flickering lights, for instance, you may have an electrical issue to address.
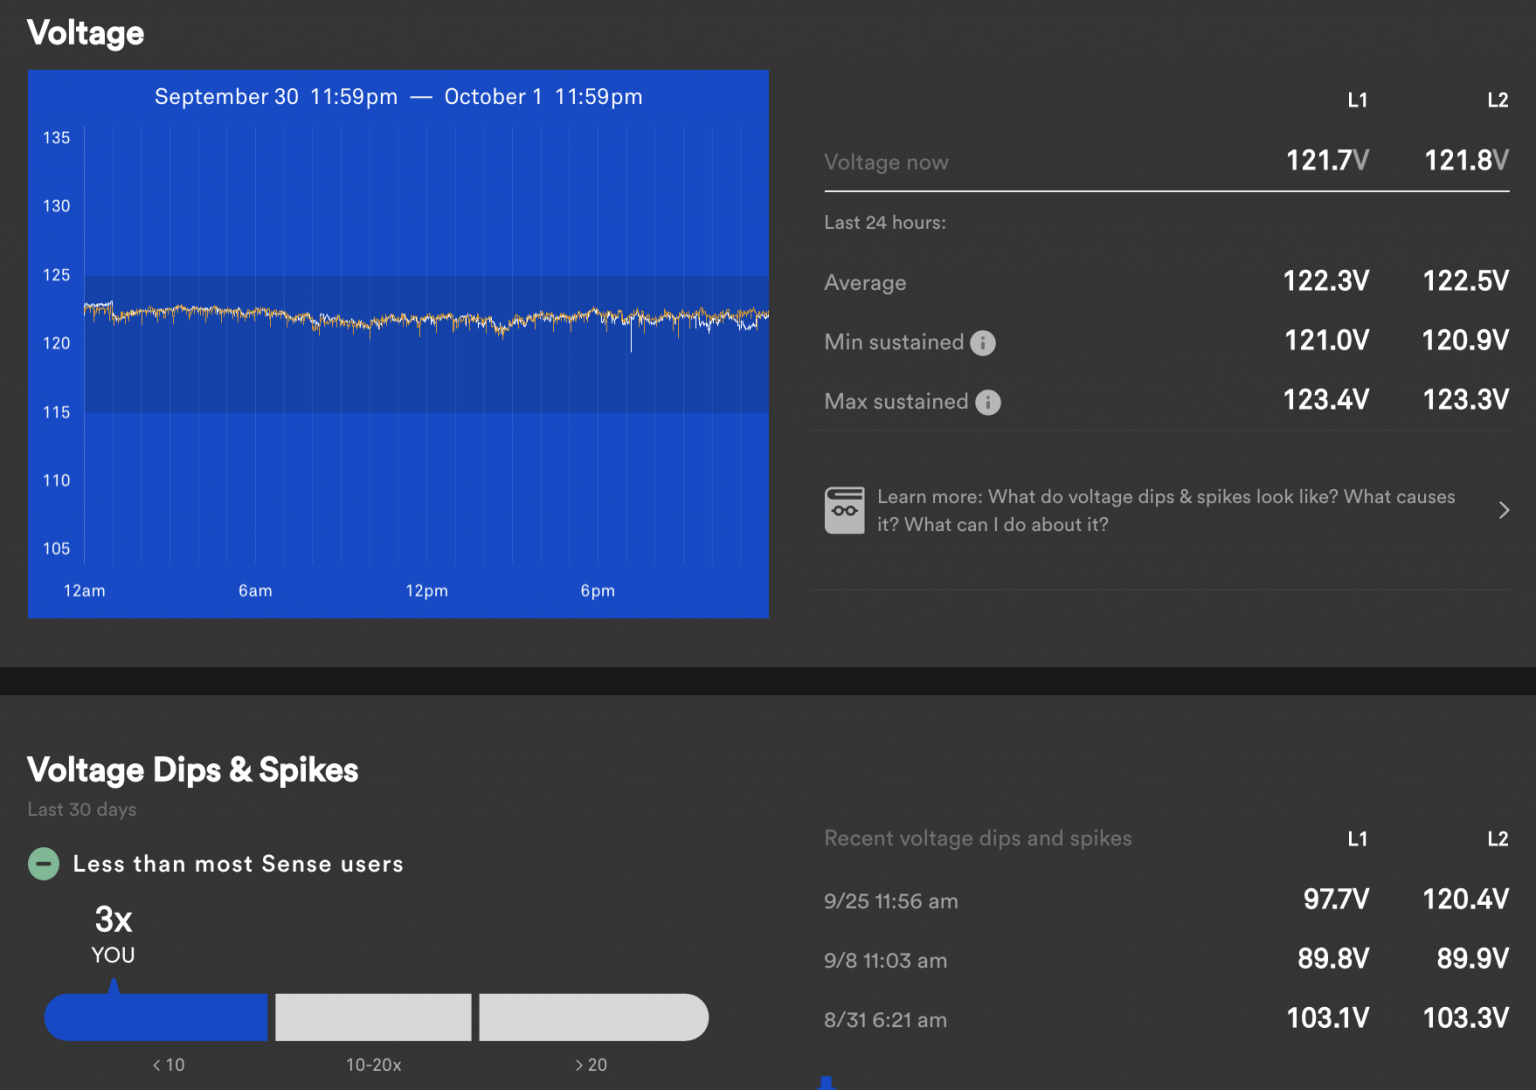
Above: Power Quality graph from Sense Labs depicting a home with consistent power quality
Understanding how your home works can keep it running reliably and safely. Those insights can give you peace of mind and might even prevent costly messes.
The post Three Ways the Sense Home App Keeps Your Home Safe appeared first on Sense.
]]>The post Is your home (electrically) noisy? appeared first on Sense.
]]>In the first month after installing the Sense Home Energy Monitor, it will find a handful of devices in most homes, starting with appliances that cycle on and off at regular intervals. Over the next 12 months, it will typically find 30 separate device types in the average Sense home. But in some homes, fewer devices are detected and it can seem like Sense isn’t working. What’s up?
A variety of factors can impact device detection in your home. Some are simple – like incorrect installation or weak wifi issues, which can be diagnosed and corrected with help from our Support team. But some homes have another issue: their appliances and home electronics are generating lots of background “chatter” that makes it harder for the Sense machine learning algorithms to sort out individual devices.
To understand how Sense detects individual devices, it’s helpful to think about an orchestra with many instruments playing. The machine learning algorithms built into Sense try to separate the sound of each individual instrument in your home from the background chatter of all the other activities in your home, and then recognize patterns in these voices to help determine what device they might be. The more background chatter there is, the harder it is to make out specific instruments.
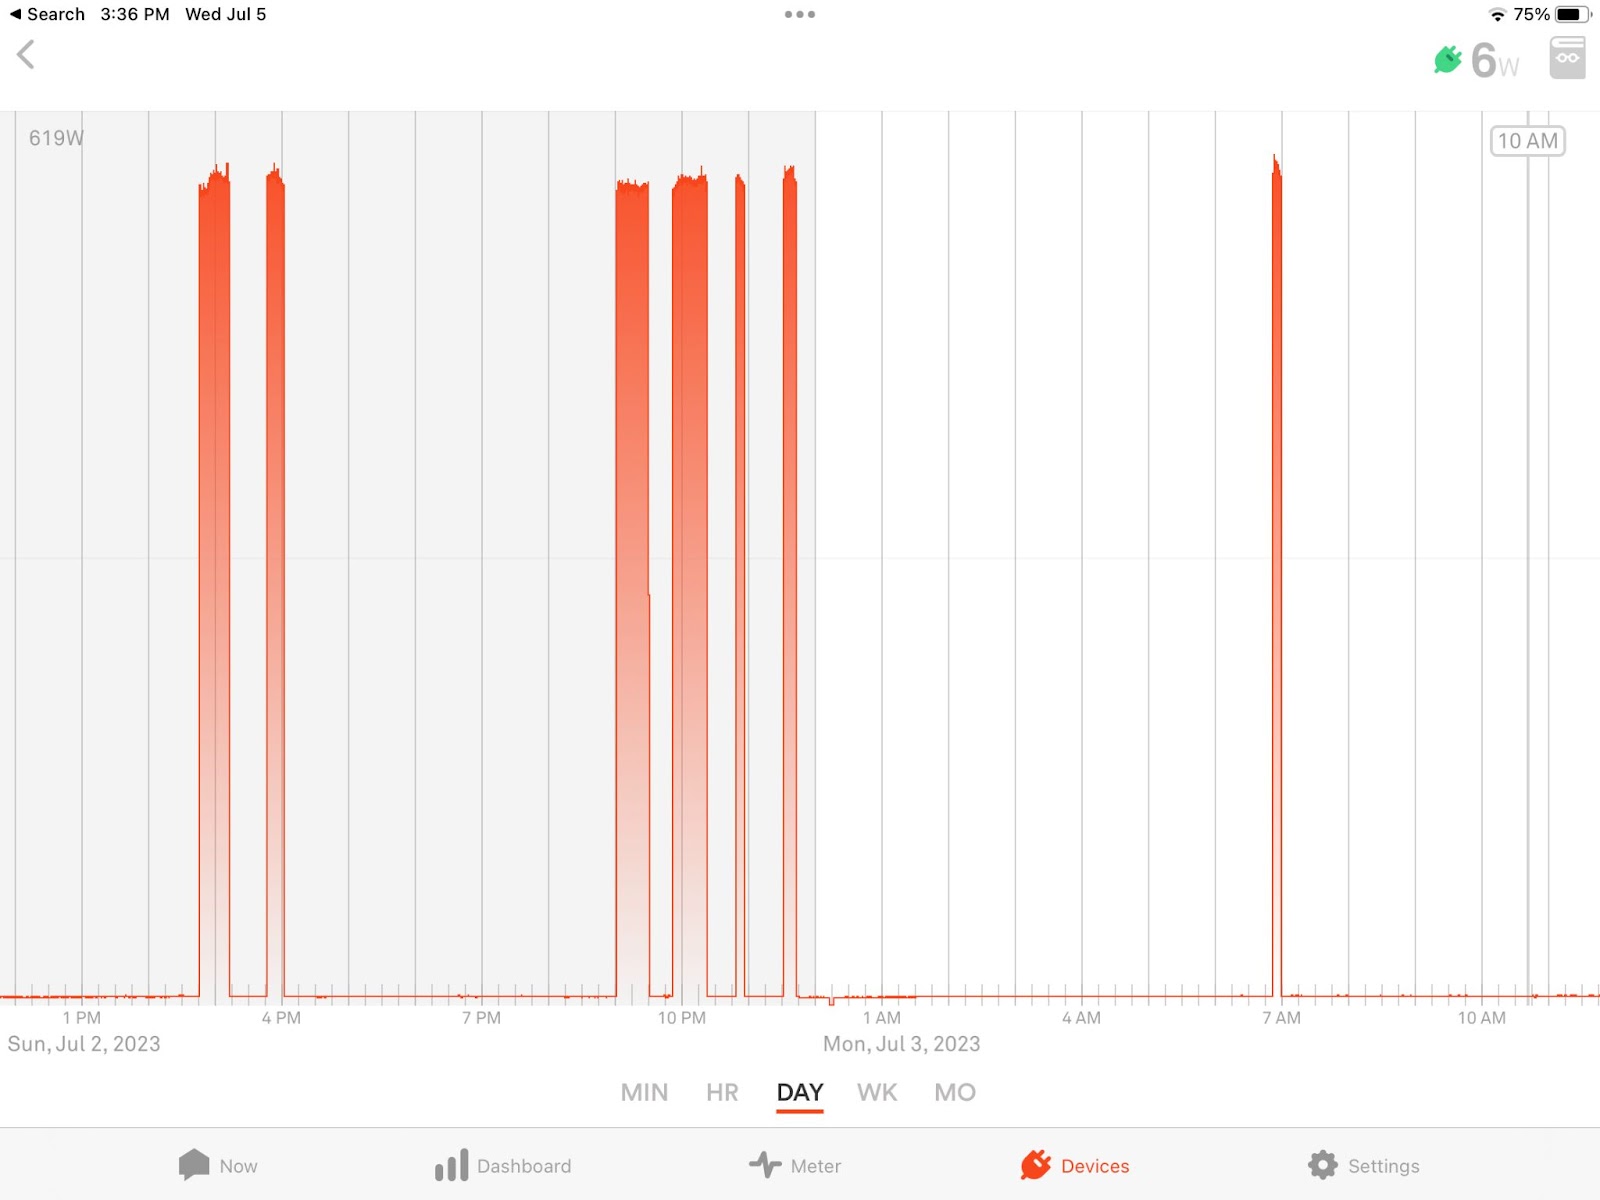
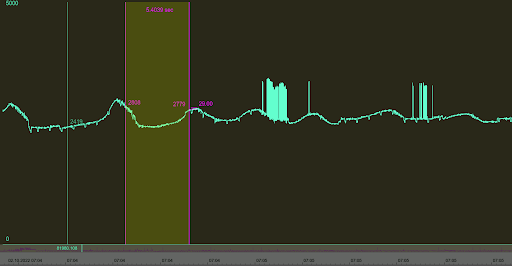
Here’s an example of a home that is electrically “quiet.” The baseline electricity stays low until something turns on, which shows up as a spike in energy usage. In this home, the electrical signature of each appliance or device shows up clearly. To compare this to your home, look at the Power Meter view in the Sense Home app and see whether there are sharp peaks and valleys.
An example of an electrically “quiet” home during a five hour period
So what are some aspects of a home that could create a lot of background chatter that interferes with device detection?
1. The wattage in your home has “high variability”
Sense works by analyzing changes in electrical usage patterns. When appliances run continuously or their energy waveforms vary up and down in an inconsistent pattern, they don’t have a unique energy signature to detect.
Appliances and other devices can have high variability. For instance, while most washing machines have distinctive energy patterns, the second part of a washing machine cycle can look like random electrical consumption. If this is happening for your washer, a smart plug or Sense Flex sensor can help track it throughout its entire cycle.
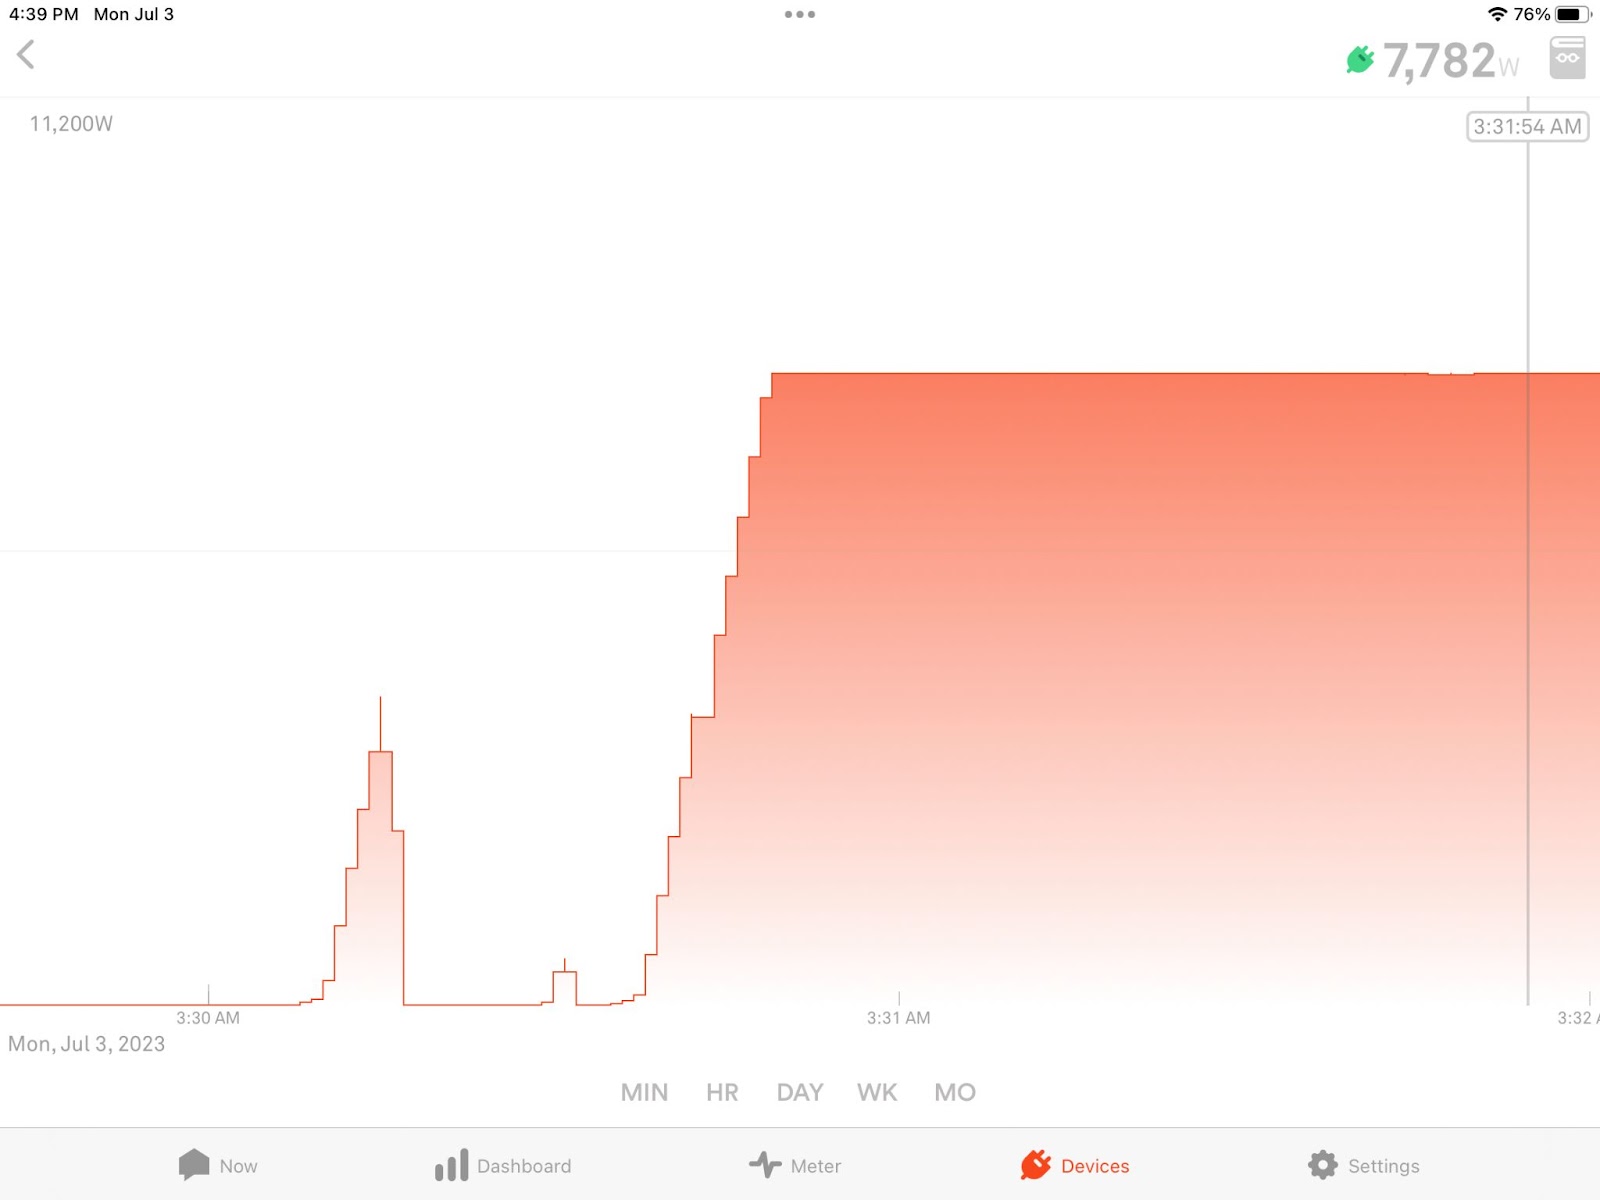
The figure below shows an electrical signature of a 2000W device that cycles over the course of five hours. But the device is not quiet at 2000W; while it’s running, consumption changes rapidly in a 300W range. If the Power Meter view of your home looks like this, device detection may take longer.
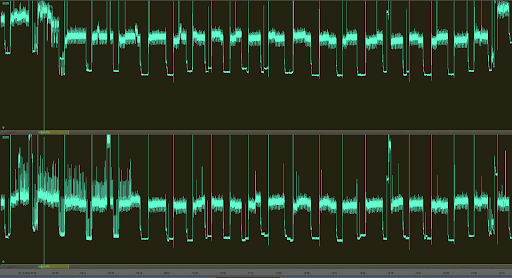
The following image shows the same signature but looking at variation in just a few seconds of electrical activity. When other household devices turn on and off, their energy signatures are overlaid by this ongoing pattern, like the loud blast of a trumpet drowning out the rest of the instruments in an orchestra.
2. Your baseboard heaters cycle frequently
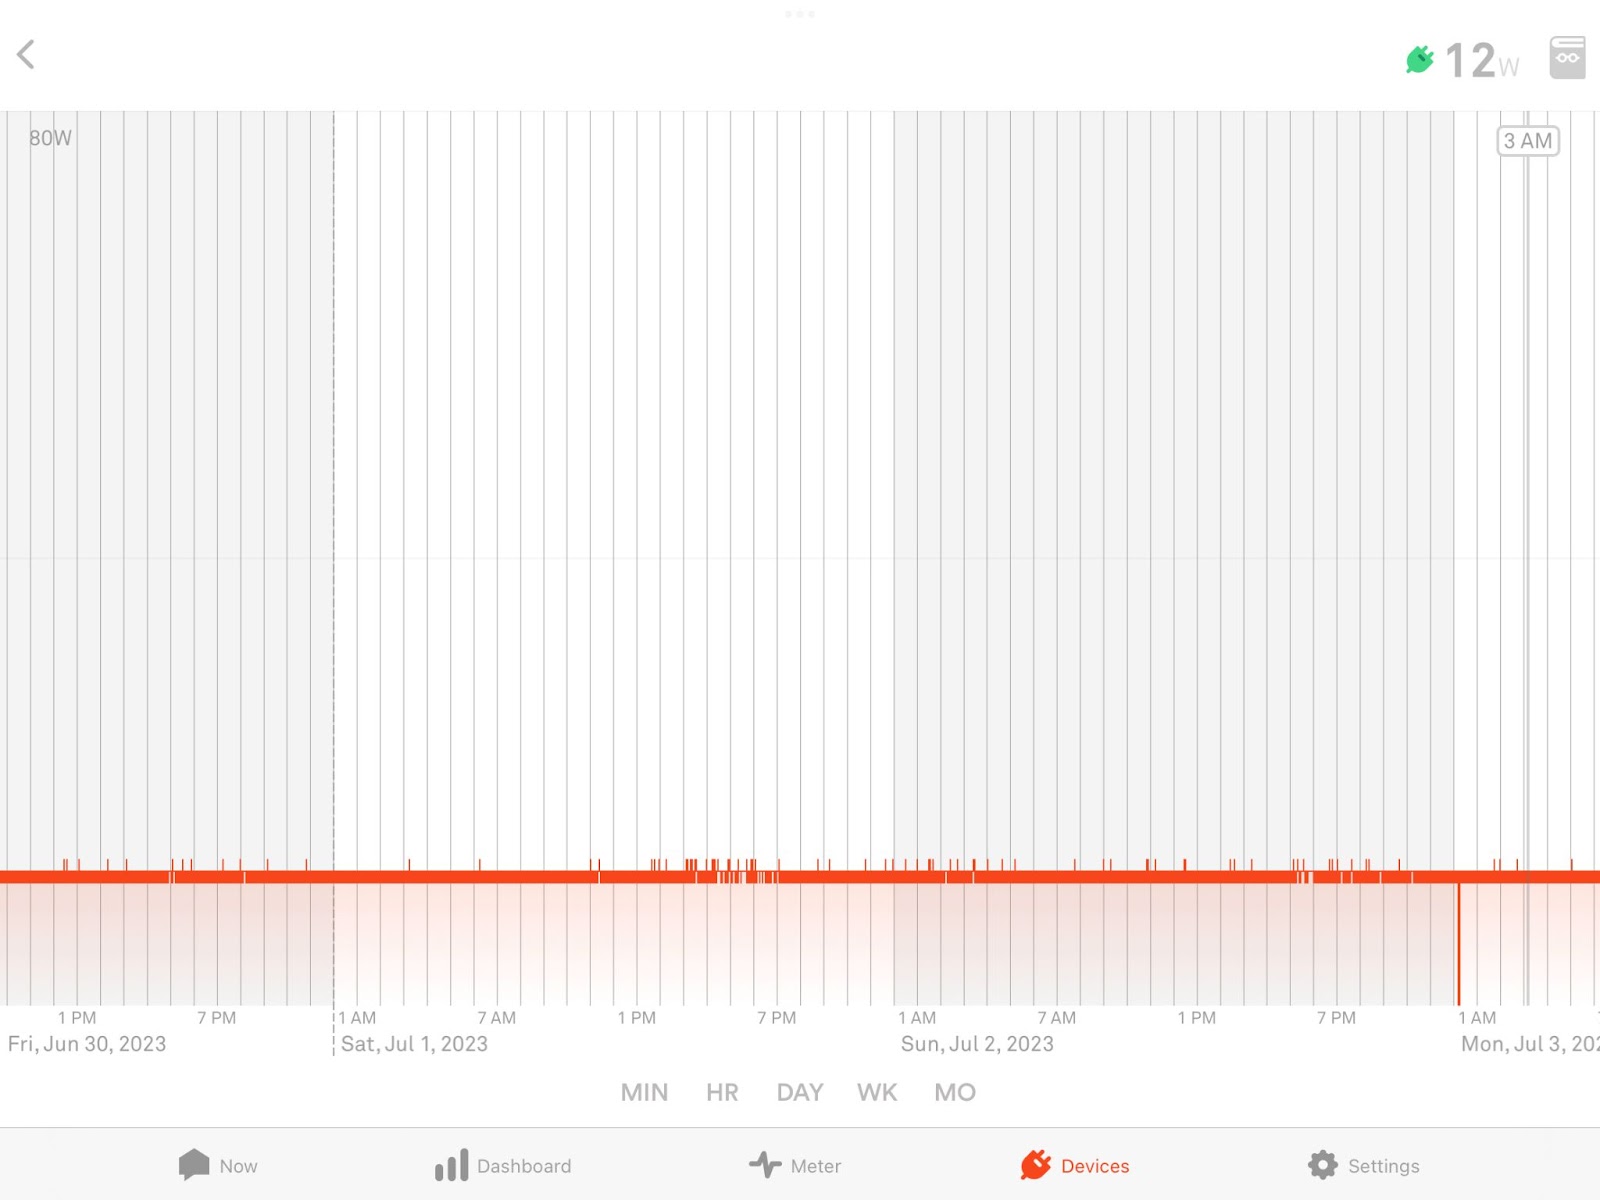
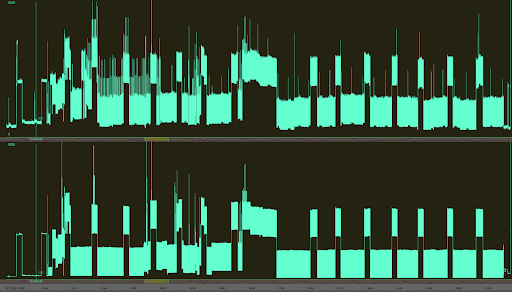
Some heating systems have variations that make it much harder to detect changes because they mask the on/off transitions that Sense uses for part of the device detection capabilities. This is the energy pattern for a 1 kW baseboard heating unit that cycles on and off at 1-second intervals (again, this shows a five-hour pattern). This type of baseboard heating is more common in Canada.
3. There are multiple heat pumps in your home.
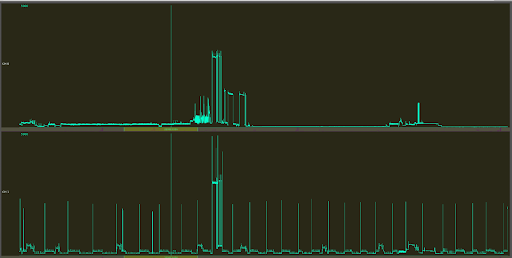
This next image shows multiple variable speed heat pumps that are on most of the time. Notice how the electrical signature varies up and down in a pattern that’s not predictable. Sense algorithms could potentially identify a single heat pump but the variability in this signal makes it difficult to detect which heat pump is turning on and off if there’s more than one.
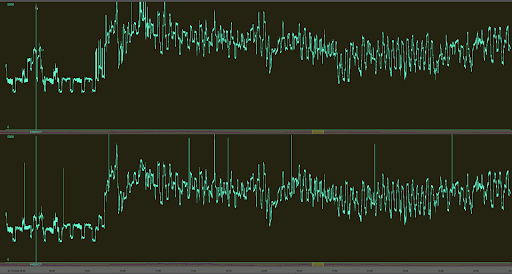
You can see this even more clearly in a detailed look of just a few minutes of the same electrical pattern.
To address these high-variability issues, you can install Sense Flex add-on sensors in your electrical panel for those circuits to identify and track the energy signature.
4. Your home has lots of electrical devices running all the time
Some household appliances, such as coffeemakers, use high levels of electricity for long periods of time, creating an electrical hum. Other devices, such as consumer electronics, always use a trickle of electricity, even when you’ve turned them off with the remote control. So how can you reduce the electrical noise and save on your electricity bills?
Here are a few tips:
If you have an electric coffee maker with a warming mode (especially Keurig brand), check the settings and set it to eco-mode, which will reduce the ongoing wattage–and save you money as a bonus.
If your computer, monitor, and printers run all the time, put your office equipment on an energy-aware smart strip to track each one, and schedule non-required equipment to turn off when not in use.
If you have an entertainment center with components that turn on automatically, put them on a smart strip and schedule them to turn off overnight. This approach still allows automatic firmware updates for smart TVs and other components.
Have some tips for managing your electrically busy home? Share them with us on Twitter @Sense!
The post Is your home (electrically) noisy? appeared first on Sense.
]]>