The post Keeping Connected: How to Improve Your Home’s Wi-Fi appeared first on Sense.
]]>Range problems, bandwidth, interference from other devices, and an aging router are some of the most common causes of an unreliable Wi-Fi network. There are fixes you can employ to solve these issues in the short term, such as relocating your router, upgrading your firmware, and prioritizing your devices. But, if your router doesn’t have the muscle to reach the connected devices in the far reaches of your home, you may need to look for a more reliable solution. A mesh network might be the answer. Unlike a traditional network that uses a single device as a WiFi access point, a mesh network places multiple access points throughout your home, giving it much greater coverage.
Ahead, learn about what might be causing your network frustrations, what measures you can take to fix them, and why a mesh network might be the best answer to your Wi-Fi woes.
Why Your Network is Dropping Devices
- Distance – Though your router may claim to reach devices up to 150 feet away, the actual range is usually much less. Walls, furniture, appliances and other obstacles that stand between the router and the devices it’s trying to reach, including your Sense monitor, can dramatically shorten a router’s range. And what’s more, if your router isn’t in a central location, it may struggle to connect to far away devices, including the electrical panel where your Sense monitor is located.
- Bandwidth – According to a recent study by Deloitte, today’s households have an average of 21 connected devices, so it’s little wonder why our home networks sometimes struggle to keep them all online. Streaming your favorite TV show while your teenager is online gaming and your spouse is video conferencing for work can overwhelm your network’s bandwidth, causing your connection to slow to a crawl. If bandwidth is the culprit, you may need to upgrade your internet plan to fix it.
- Interference – Your router isn’t the only thing sending invisible radio waves through your house. There are a wide range of household gadgets and appliances that use radio waves or send out electrical signals, including baby monitors, Bluetooth devices, and microwave ovens, not to mention your neighbor’s Wi-Fi network, all of which can disrupt your router’s signal, resulting in dropped Wi-Fi connections.
- Obsolete router – A router’s lifespan is surprisingly short. According to Consumer Reports, they only last a few years before the chips inside them become obsolete and begin showing their age in the form of poor performance. In fact, major router manufacturers such as Linksys, Google, and Netgear, all say customers should replace their router at least every five years, sooner if you use a lot of high bandwidth devices.
- Old firmware – Your router’s firmware is the software that controls its features and performance. Router manufacturers regularly update this firmware to improve the router’s performance and security. Failing to keep up with firmware updates for your router can slow your network down and cause connectivity issues.
- Wrong network or frequency – If you haven’t changed your router’s default name, also called its SSID, or you’re using a generic name for your network, your wireless devices could be confusing your network with a neighbor’s that uses the same default username, causing them to drop off your network.
Quick Fixes
- Move the router – If your router is set up against an exterior wall, try moving it to a central location in your home to maximize coverage. Since routers send their strongest signals in a downward direction, placing it on the floor will dampen its signal, so sit it on a shelf instead. Keep the router away from walls, large pieces of furniture, and other electronics, all of which can disrupt the signal.
- Check your frequency – Most routers can send and receive data via both 2.4 GHz and 5 GHz frequencies. While 5 GHz is the faster of the two, it has a much shorter range of about 50 feet indoors. A 2.4 GHz frequency isn’t as fast but has triple the range, making it ideal for devices that are further from the router. This long range is precisely why the Sense monitor is designed to use a 2.4 GHz frequency.
- Change the network name (aka SSID) – If you never changed your Wi-Fi network’s SSID, or if your network has a generic name, then there’s a chance that a nearby network has the same one. Your devices could be attempting to join this doppelganger network. Use one of your devices to check the names of neighboring networks. If you find a match, rename your network to something unique that doesn’t include any part of your network password or any personal information.
- Prioritize your Devices – Online gaming and streaming video might be hogging bandwidth from your essential devices, such as your Sense monitor. You can prioritize which devices get dibs on your network’s bandwidth by going to your router’s Quality of Service (QoS) settings. You’ll find them in your router’s settings, which you can access by typing the router IP address into a browser if you own it or by logging into your ISP’s portal if you’re leasing it. These controls allow you to designate the devices that connect to your network as high, medium, or low priority, ensuring your essential devices stay connected during periods of high use.
- Add a Wi-Fi extender – One way to solve range problems with your router is to add a Wi-Fi extender to your network. These devices plug into a standard wall outlet midway between your router and a dead zone. The extender receives the Wi-Fi signal from your router and boosts it so devices in these hard to reach spots can connect to your router. There is a downside to Wi-Fi extenders. Since they add an extra go between for the signal before it reaches devices, it cuts the internet connection speed by about half.
- Get help from your ISP – Given that they’re the ones supplying you with the internet, your ISP can often help diagnose and fix network problems, and they usually won’t charge you a service fee to do so.
A Solution for Meeting the Modern Home’s Wi-Fi Demands
While the above methods may help you get by for a while, a more reliable solution to helping you connect to your Sense monitor and other devices that dwell in those harder to reach parts of your home is to invest in a mesh network. Mesh networks use multiple devices to extend your Wi-Fi signal dramatically, eliminating dead zones without compromising speed.
Here’s how they work. As with a traditional Wi-Fi network, a mesh network uses a router that connects to your modem to receive internet. With a mesh network, the router also functions as a base that rebroadcasts that internet signal to a series of other devices called nodes. These nodes are positioned throughout your home and serve as wireless access points that allow the network to cover a much larger area than a single router. In fact, a mesh network can cover up to 5,000 square feet depending on how many nodes you have, enabling your Sense monitor and other devices located in the farther corners of your home to stay connected.
And since the base and nodes all use the same network, you don’t experience the loss of speed you do with a Wi-Fi extender. Mesh networks are also expandable, so you can start with a more affordable two-piece kit then expand with additional nodes as you need them.
While a mesh network requires more of an investment than the above patches, it presents a permanent and reliable solution to your Wi-Fi problems.
An intermittent WiFi connection can leave everything from security cameras to smart televisions to your Sense monitor offline. Luckily there are measures you can take to improve your network performance. Moving your router to a more central location in your home, updating its firmware, and optimizing its settings can ease network connectivity problems. If these measures fail, consider expanding its range by investing in a mesh network. With multiple access points throughout your home, a mesh network can keep your Sense monitor and other devices that are located far from your network’s router connected.
The post Keeping Connected: How to Improve Your Home’s Wi-Fi appeared first on Sense.
]]>The post Behind the Scenes: Tracking the Elusive Air Conditioner appeared first on Sense.
]]>Can you tell us how Sense is able to detect air conditioners?
Before telling you about our approach, let’s start with the most common types of ACs in peoples’ homes. There are three main types. First is window air conditioners, running at 120V. The second category is central HVAC systems, nearly all of which are 240V systems that consist of a cooling unit and a ducted system that blows the cool air to various parts of your house. The third category is mini-splits, which usually use 240V. They have two components: an air-handler, typically installed on the room’s wall, and a condenser unit outside the house that forces cold refrigerant through a tube in the wall to the air-handler.
In all three types of systems, there are two major components: a fan with a motor and a compressor that cools the air. When Sense is detecting air conditioners, it looks for the compressor coming on because it is an inductive motor with an electrical pattern or “signature” that’s quite distinctive. It also uses the fan’s motor to help identify the air conditioner.
There are lots of other motors turning on and off in the average home. So we look for other clues to identify exactly which kind of motor it is. Since Sense measures both “phases” coming into the house, it can look for motors on both phases or on one phase. If a motor’s energy signature is on just one phase, it’s likely to be a fridge, window AC or dehumidifier. If it’s on both phases, it could be a central AC, pool pump, or well pump.
Now Sense’s task is to figure out which device is turning on. The cycling nature of the device hints at what kind of device it is, too. Refrigerators need to keep food at a single temperature, they are extremely well insulated and the home environment usually stays in a pretty narrow temperature range. So they cycle on and off in a regular pattern throughout the day.
By contrast, when your thermostat triggers the air conditioner, it is constantly responding to swings in temperature from night to day and through various weathers. If it’s 70 degrees outside, the AC system may barely cycle at all; if it’s 90 degrees, the AC system has more frequent, longer cycles. So those longer and more irregular patterns are a clue to Sense that an air conditioner is turning on and off.
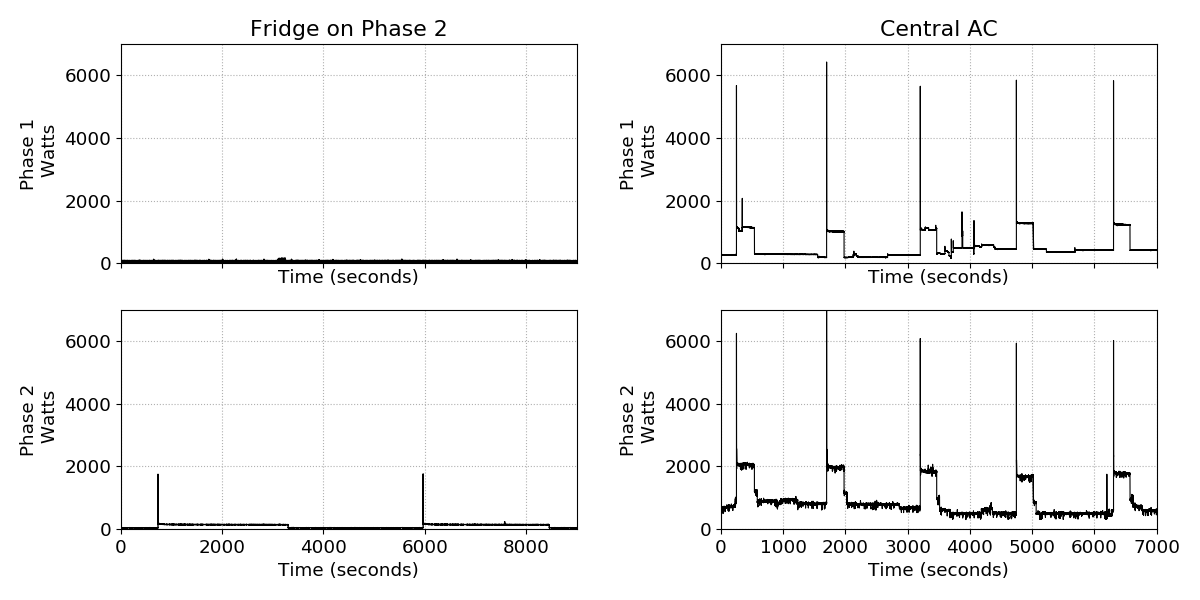
A typical refrigerator on the left and a typical AC on the right. The central-AC is on both phases (phase 1 and phase 2) and is a 240V device. Refrigerators, on the other hand are 120V devices.
It sounds like Sense can identify most air conditioners well, based on their patterns. Does it get confused sometimes?
Yes, we’ve found that Sense identifies most window air conditioners and central HVAC with a single AC unit. But the home environment can be complicated, so there are a few wrinkles we watch out for.
Some HVAC systems in larger homes have multiple AC units built into them, which introduce multiple combinations of energy signatures. If they are different models, Sense will recognize their different signatures as ACs. If the compressors are identical but the blower fans are wired on different phases and in synch with the compressors, the Sense monitor might identify each compressor unit separately and tell you when each compressor turns on or off. If the fans and the compressors are both identical, both ACs look identical to the Sense monitor rather than two distinct devices.
If the compressors turn on in synchrony at times, the power waveform will look entirely different. The second AC does not appear as a different device, but instead looks identical to the first one, and Sense finds it impossible to accurately determine when each device actually turns off (and hence look for the next switch-on) since the turn-off events of both the ACs look identical. And if the compressors are out of sync, you get even more unusual cycling patterns, which don’t match a single AC unit’s typical signature. Luckily, we believe this scenario impacts a small minority of Sense customers users, perhaps 5%, who have larger homes with bigger systems.
These more complicated scenarios can generate duplicate AC detection by Sense. We are constantly improving our algorithms to identify and untangle these kinds of duplicates.
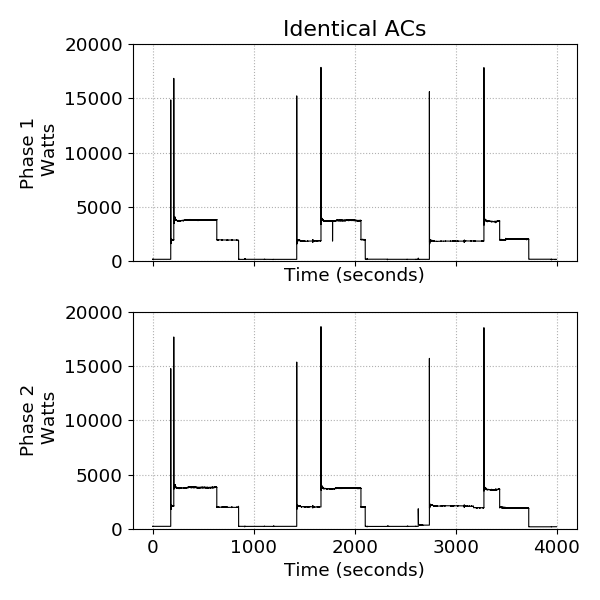
A house with two identical ACs.
Mini-splits are a challenge, too, because they use variable motors, which have less easily detected patterns as they turn on and off. Read more on that topic below.
Air conditioners only run in the summer. Does that complicate the device detection picture?
That’s a great question. Sense’s machine learning algorithms need to see a device turn on and off many times in order to identify it positively. So let’s say you install the Sense monitor in June, when it’s just getting hot. Then July comes along, the hottest month of the summer. Your AC is working hard and Sense will have lots of opportunities to see it turn on and off. By August or September, Sense has built models of your air conditioner’s energy signature that have been verified over and over.
Now, what if you install the Sense monitor in August instead? Depending on where you live, the air conditioner may be turning on far less frequently with cooler weather. Sense will detect your air conditioner but its models will continue to improve in the early months of the following summer.
Sense keeps the most reliable models based on the entire summer’s worth of AC activity. In practical terms, this means that Sense may detect your air conditioner more accurately the second summer it’s in your home.
We’ve advised readers not to leave the fan on a central AC running. Can you talk about why that’s not a great idea?
The first reason is the energy cost. Anything that runs continuously will have a high vampire load. A typical central AC could use 200W in fan-only mode, and if you multiply that by 24×7 over the course of perhaps 4 months, you are spending $90 just to move air through your home. If you want fresh air, open the windows – it’s free! Window fans and room fans use about half the energy of a typical central-AC fan, so they will save you money in the long run, too.
Sense categorizes anything that runs continuously as Always On. Devices that stay on continuously lack a distinctive energy signature–you could say they are electrical white noise. So a continuous fan mode is not detected as part of your air conditioner, which might skew the math if you are trying to get accurate data for your HVAC costs.
Why are mini-splits harder to identify?
Unlike air conditioners with inductive motors like central and window ACs, which have a distinct power signature, mini-splits have a variable-speed, electronically controlled motor. As a result, mini-split power consumption changes gradually and it is harder to identify. To make matters worse, the speed and pattern of this slowly changing power consumption can be different for various models and makes of mini splits.
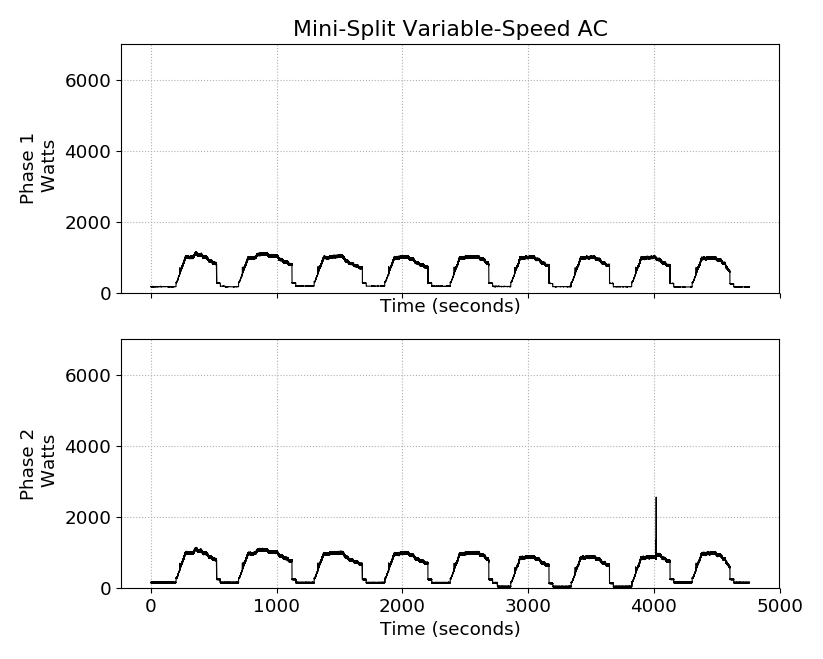
A typical variable speed mini-split AC. The power changes gradually in each cycle of the AC without big spikes of energy.
To address this, we’re exploring ways to match outdoor temperature data to the home’s energy usage. This approach could yield good results for monthly usage data for HVAC systems with identical ACs or mini-split systems.
At Sense, engineers like Mahesh are pushing the boundaries of AI and energy tracking. Thanks, Mahesh, and stay cool the rest of the summer!
Check out our related blog posts, The Cost of Staying Cool This Summer.
The post Behind the Scenes: Tracking the Elusive Air Conditioner appeared first on Sense.
]]>The post Video: Data Science at Work appeared first on Sense.
]]>The post Video: Data Science at Work appeared first on Sense.
]]>The post The Always On Gap appeared first on Sense.
]]>In September, Sense analyzed the homes of more than 4,000 Sense customers across North America, and confirmed the 23% figure for Always On energy usage. Homeowners pay approximately $308 per U.S. household annually to keep Always On devices running.
In fact, Always On appliances and electronics use more electricity in the average home than lighting, refrigeration, and space heating combined and nearly equivalent to the energy drain from air conditioning and electrical water heating together (source: US EIA).
To assess what contributed to such a high level of Always On usage, Sense customers participated in a survey that has yielded uniquely detailed insights. By combining both sets of data, we learned that consumer electronics, which stay on continuously at various energy levels, are significant drivers of higher energy usage in homes, along with some home appliances.
We discovered that the homes that use the most energy overall — the top 10% — are also the homes that reported the highest numbers of consumer electronics and Always On appliances like aquariums and pool pumps. All those devices humming along add up to a much higher electricity bill and carbon footprint. In short, big homes filled with gadgets that keep running unchecked are wasting lots of energy.
This is the second post in a three-part series of blogs highlighting our findings. You can find our complete, detailed research findings here.
Methodology
With our customers’ permission, Sense analyzed energy data from 4,271 homes whose owners responded also to a brief survey, which asked their zip code, number of household members, the year their house was built, and the total square footage. We also asked respondents to enumerate the consumer electronics and other electrical devices in their homes, choosing from a list of devices that stay on continuously, including consumer electronics such as TVs, streaming media devices, game consoles, and cable boxes, and appliances like dehumidifiers, hot tub heaters, and pool pumps.
Insights
We learned that the electricity that lets you turn on consumer electronics instantly with a click and keep pool water clean has gone from a trickle to a flood that uses almost a quarter (23%) of home energy. This number is consistent with an analysis of Pacific Gas & Electric customers in California, reported by the NRDC in 2015.
Based on the U.S. average monthly utility bill of $111.67 and an average price of $.1289 per kWh, the typical household now spends $308 annually to keep their gadgets running continuously, even when they are not in use.
To understand what factors have the highest impact on Always On energy, we analyzed increases in Always On energy use relative to a home’s total energy use against four variables: family size, home size, number of consumer electronics, and number of always on appliances.
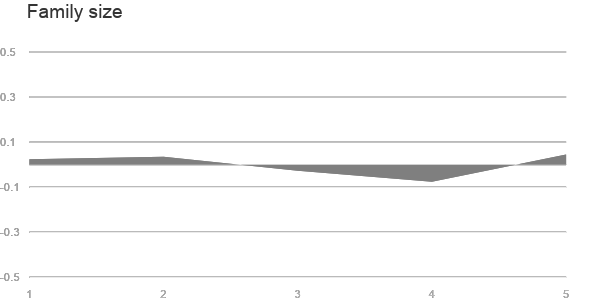
We saw no consistent correlation between family size and energy usage of Always On devices. As family size increased, Always On hovered around the mean.
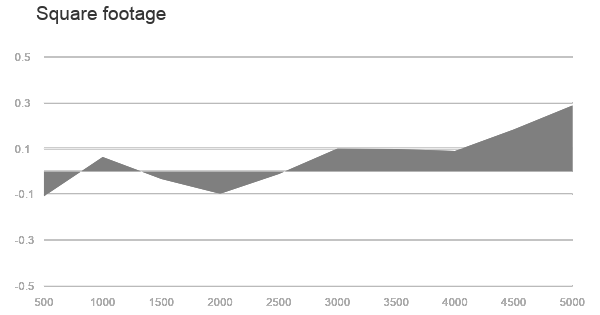
When we looked at home size, however, we saw a clear correlation: Always On energy increases with home size, relative to the mean, with a steep slope upwards at 4,500-5,000 square feet. A 5,000 square foot home consumes 51% more total energy on average than a 2,500 square feet house and 97% more Always On energy — regardless of family size. Something is going on in larger homes to boost energy usage.
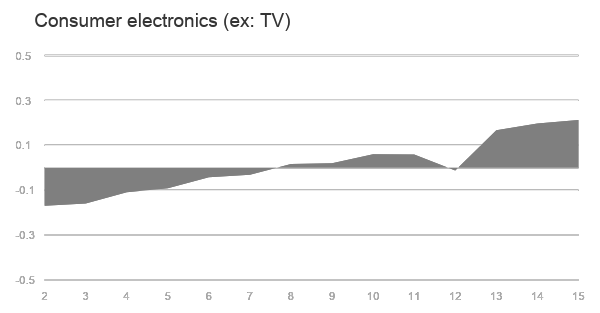
Next, we looked at consumer electronics and found another very strong correlation. In homes with 15 consumer electronics, the total energy usage doubled and the Always On usage quadrupled. Filling your home, whether it’s big or small, with lots of consumer electronics has a strong effect on home energy usage. Your home theater components — TV, DVR, Blu-Ray player, game console, cable box, and streaming device — use more energy than you might think.
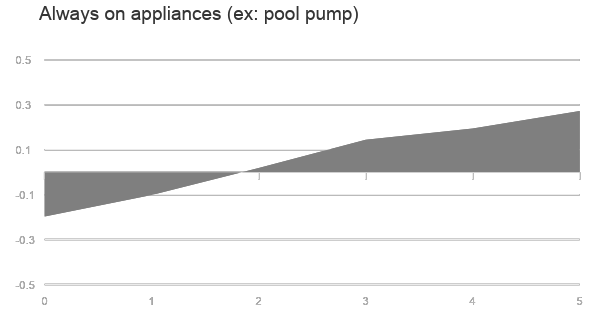
Finally, we looked at the data for appliances like pool pumps and hot tubs that run continuously for long periods of time. In homes with 5 of these devices, Always On swelled to 32%, which is 50% above the mean. Pools, aquariums, electric baseboard heaters, dehumidifiers, hot tubs, fans, and security cameras are among the culprits.
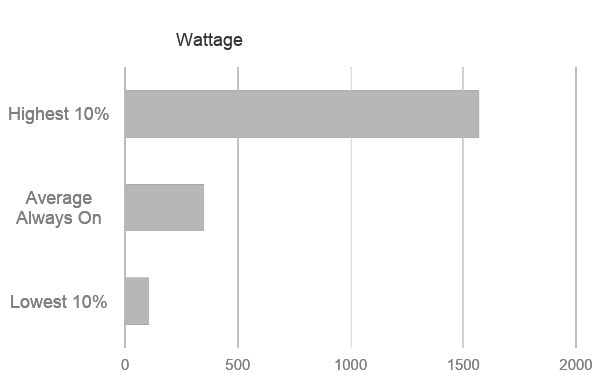
Having seen a big jump in energy usage in the largest homes with the most Always On devices, we decided to make another comparison. We looked at the homes in the top 10% of energy consumption — those that consumed 3,090W on average — and compared them to the bottom 10%, who consumed 528W on average.
One would expect that as house and family size grow, homes will have more appliances and electronics and therefore total home energy use and Always On increase in tandem. Instead, Always On accelerates much more rapidly. Homes in the top 10% of energy use (the “guzzlers”) consume nearly 500% more energy than those in the bottom 10% (the “sippers”), but have an Always On that is nearly 1,500% higher. This gap could be explained by homeowners filling large houses with many devices that constantly drain electricity even though they are not used by family members.
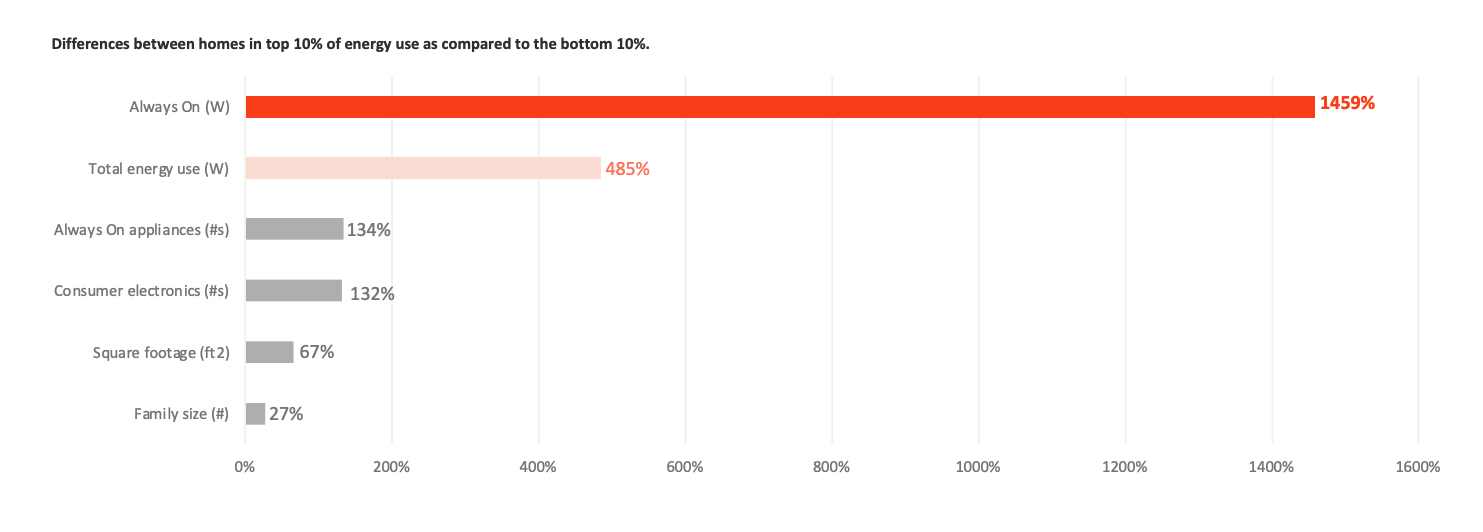
In fact, the guzzlers’ energy consumption was so high, they accounted for 30% of total Always On energy use across all 4,270 homes sampled. This analysis points to the outsize impact of the most wasteful homes in the residential energy picture.
Educating homeowners about this hidden energy drain and developing incentive programs through utilities has the potential to significantly reduce energy usage across the country. In our next blog post, we’ll explore the implications of our findings for consumers, utilities, government policy, and climate change.
The post The Always On Gap appeared first on Sense.
]]>The post Machine Learning vs. Human Learning appeared first on Sense.
]]>Machine Learning vs. Human Learning
To understand the answer to this question, one must consider the variability inherent in the various situations. Human learning, on the one hand, is exposed to a tremendous range of variability, and we somehow meta-learn to distinguish between extraneous variability and meaningful content – how we achieve this is one of the major mysteries of modern science.
For applications such as electronic banking, we reduce the variability by careful design so that their input information is completely unambiguous – making instantaneous updates possible.
State-of-the-art machine learning applications – including computer vision, speech recognition or device recognition by the Sense monitor – are between those two extremes: we unfortunately cannot (yet?) match the contextual learning abilities of humans, but are forced to deal with more variability than typical database-driven applications (e.g. e-banking).
In machine learning we usually deal with variability by collecting several examples of the targeted object (garage-door opener), and of competing objects that we do not want to confuse with the target (all the other appliances in your house).
All these examples are processed by an algorithm such as Deep Learning or Hidden Markov Modeling to reliably recognize the object of interest. But this reliability depends on the samples being sufficiently representative of both the target class and all the other, potentially confusable, objects. Therefore, “teaching” the system with just a few examples of the targeted device is not feasible in our current paradigm.
Note that these examples have rather similar wattage traces (shapes) and durations, but that there is some variability between the different examples. The baseline values before and after every event are also not the same, showing that different sets of other devices were on in each of these instances.
This is why Sense needs to see many repetitions of your device working in its typical context, to be sure our models account for all potential variations. The Sense integrations with smart plugs from Wemo and TP-Link have been critical in helping to expedite this process, while providing immediate detection of the devices they’re plugged into. User feedback is also critically important to the training of our algorithms in the categorization and naming of so-called “Mystery Devices” that appear in the Sense Home app as something like “Heat 1” or “Motor 3”. Adding categories, names, and make/model information helps to connect the recognition of these contextual models to a collection of user-submitted descriptors, so that more and more devices can be discovered automatically and accurately.
The post Machine Learning vs. Human Learning appeared first on Sense.
]]>The post Spotting a Microwave Oven in the Wild appeared first on Sense.
]]>How this came to be is an interesting story in itself. Here I want to share some of the clues appliances offer in their electricity consumption patterns, and how Sense uses these clues to detect devices.
As background to my explanation, let me first provide a little information about the operating principles of a standard commercial microwave oven. The core of such an oven is the cavity magnetron, which generates a stream of high-frequency electromagnetic waves (microwaves) from an electric power source. The magnetron is an extremely ingenious device: it consists of a cathode which produces a steady stream of electrons, surrounded by an anode. When suitable high voltages are applied to both anode and cathode, the cathode electrons induce currents in the anode, which in turn lead to microwave-frequency resonances inside of the anode. These oscillations are tapped with a strategically-placed antenna, and directed to the interior of the oven where they do their magic with our popcorn, pizza or pork chops.
The wattage-against-time signature for one run of a typical microwave oven is shown below.
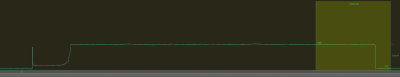
(The signature is a snapshot lasting 18 seconds, of which the highlighted section spans about 3 seconds, and the steady-state power with the oven in operation is about 1700 W above the baseline wattage). So, can you explain the main features of this signature after reading the relevant Wikipedia section?
Let’s work backwards from the major power sink that is consuming around 1700W for the last 13 seconds or so of the signature. Since the magnetron is the main source of microwaves, this must be the signature of the magnetron as it is drawing current to produce those heating excitations. The slight waviness of the power consumption confirms that this is the case: the resonance currents are the result of a complicated dynamic system, and is known to result in some variability in the microwave power produced. This, in turn, means that the electricity consumed by the magnetron is somewhat variable, as we see in the signature.
The next most noticeable item in our signature is the sharp peak near its beginning. Remember, this is wattage against time, so something is drawing a large amount of current for only a brief amount of time. The peak actually results from two different components being charged up – in some microwave ovens, they in fact show up as two separate peaks, separated by about 100-500 milliseconds. These components are a high voltage transformer and a capacitor used for voltage doubling; both produce a strong surge current when voltage is first applied.
And what about the region between these two events? There is clearly some non-negligible energy consumption during that period (around 230W over about 1.5 seconds for this sample), and this has to be the current drawn by the cathode as it warms up and spews forth the stream of electrons that will drive the magnetron during steady state-operation of the oven.
Is that all? Well, not quite … If you look at the section before the initial transformer-capacitor surge, you see that the power consumed drops by a few watts for a brief period. Negative wattages can only mean that something has turned off – in this case, probably the oven light which turned off automatically when the oven door was closed.
These four elements are typical of many microwave ovens, but there are many variations – so many, in fact, that I hope to write a blog on some of the typical variations in the near future.
Now that you have read about how the Sense home energy monitor detects microwaves, are there specific devices you are curious about? To learn more about how Sense conducts device detection to identify specific appliances drop us a note at feedback@sense.com or tweet at us @tellsense and let us know which appliances you would like to read about next.
The post Spotting a Microwave Oven in the Wild appeared first on Sense.
]]>The post How Does Sense Detect My Devices? appeared first on Sense.
]]>Let’s say that your toaster, when on, is the only device in your home that uses 1200 watts. If that were the case, Sense could just look for those occasions where your total electrical consumption increased by 1200 watts, and determine that your toaster must have turned on. Then, when your consumption decreased by 1200 watts, Sense could infer that the toaster must have turned off.
If only device detection was that simple! You probably have many things in your home that use 1200 watts, and besides, most of the devices in your home are much more complicated than a toaster.
And, it turns out, even the toaster isn’t so straightforward —the electrical resistance of the heating element in your toaster increases with temperature. This means that as the toaster heats up, the wattage it uses declines, so it’s using less than 1200 watts by the time it turns off. And, to complicate matters even further, if you make more toast right away, it uses less than 1200 watts when it starts back up.
So, how does Sense detect devices? We use more complex signals than just the overall wattage, and the models we use are much more complex than just assuming things turn on and off in simple and consistent ways.
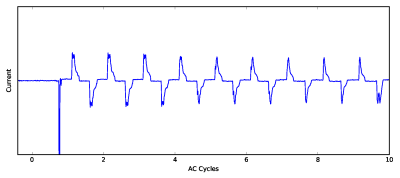
On the signal side, below we show a few waveforms of the current usage of a couple of different devices. Notice that there are tons of details available in these waveforms, which go far beyond simple wattage calculations.
The first image depicts the toaster, which is just a resistive load. This means (based on physics!) that the current is exactly aligned with the voltage with a pretty stable relationship (it does get slightly smaller over time based on the heat/resistance relationship discussed above, but the effect is smaller than you can see in this chart).
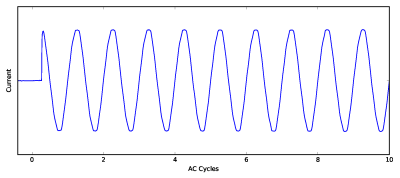
Next is an incandescent light bulb. It too is a resistive load, so the current follows the voltage as in the toaster example. But the tungsten filament of the light bulb heats up far more quickly than a toaster, so you can see the current usage dropping over just a few cycles (60 cycles per second, so drop happens over 30-40ms).
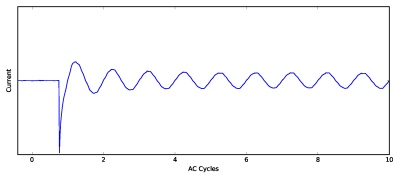
The last example is from a CFL light bulb. Notice there is a very sharp spike when it starts – this is caused by a capacitor charging up to power the electronics. Once it starts, the current waveform looks quite different than the nice voltage sine wave. This is very common for electronic devices in your home, and the particular shape of these waveforms and how they startup are important device detection clues for Sense.
Those are just a few examples of one particular signal type. The tough job for our Sense data science team is to map out the entire space of how signatures appear in the signals (and we look at many more types of signals) and then to map those various signals to the complex devices in your home, which consist of combinations of many elements all doing different things in these electrical signals. We have just scratched the surface so far, but we are already starting to recognize many common devices in homes. We have many more devices and features coming soon. Stay tuned!
The post How Does Sense Detect My Devices? appeared first on Sense.
]]>